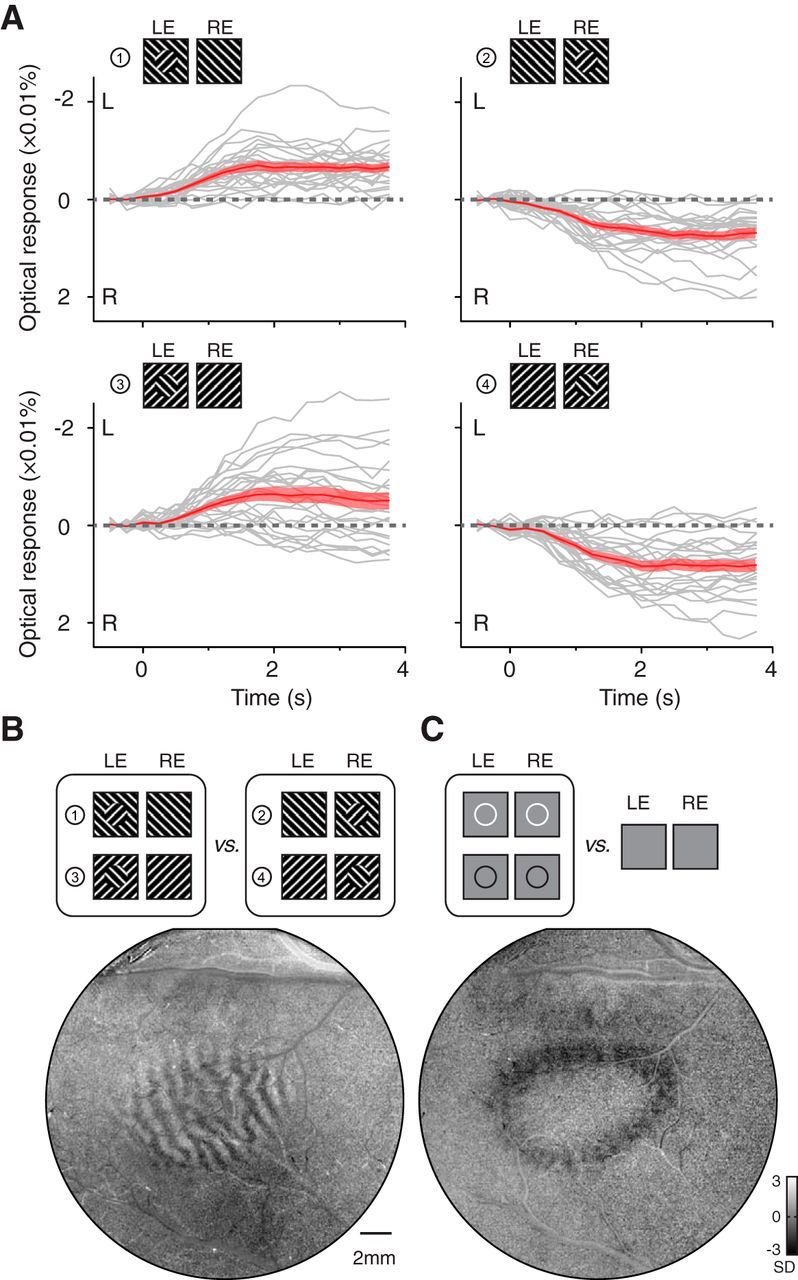
Figure 3.

V1 alternation modulated by boundary contours. A, Response time courses for four different configurations of MBC stimuli having rivaling centers. The gray curves are individual L–R time courses (n = 25) calculated from the V1 region corresponding to the central disk. The red curves are the average time courses (±SEM). V1 activation clearly showed biases toward the eye viewing a boundary contour. B, An OD pattern was revealed in the contrast map comparing left-eye (LE) and right-eye (RE) MBC conditions (the same data as in A). C, V1 retinotopic representation of a circular contour (line width 0.1°) confirms that the eye dominance in B was within the disk representation.
