Figure 6.
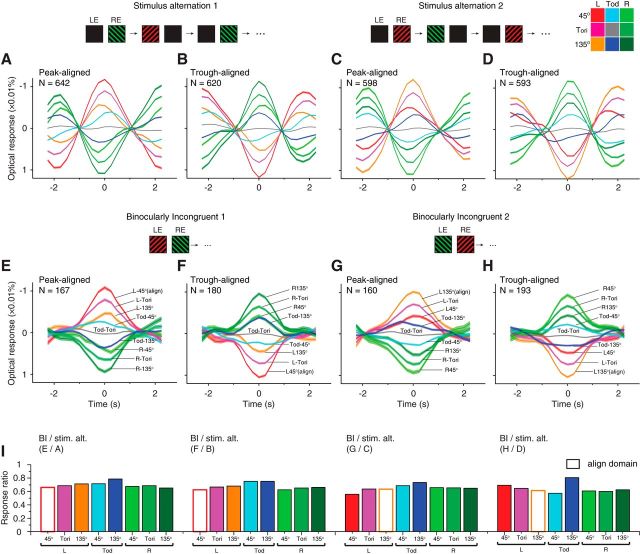
Comparison of fluctuation amplitudes in stimulus-alternation and BI trials. A–D, Similar to Figure 5B, aligned and averaged stimulus-alternation responses in nine functional compartments (color code in top right corner). A, B, Response to L45R135 stimulus-alternation aligned with L45 peaks (A) or troughs (B). C, D, Similar to A and B but for L135R45 stimuli. E–H, Similar to Figure 5C, aligned BI responses in nine functional compartments. E, F, Averaged domain responses to L45R135 BI stimuli, aligned with L45 peaks (E) or troughs (F). G, H, Similar to E and F but for L135R45 BI stimuli, aligned with L135 peaks (G) or troughs (H). Note that except for the widths of the cycles, the response profiles for BI stimuli are generally similar to those in corresponding stimulus-alternation results. All curves were plotted as mean ± SEM. I, Response amplitude ratios for BI and corresponding stimulus-alternation curves. Labels above each panel indicate from which two panels the ratios were calculated. The response amplitudes for TODTori domains were too small to obtain meaningful ratios, and thus were not plotted. On average, the peak amplitudes for BI stimulus were 67.4% of those in the stimulus-alternation conditions.

