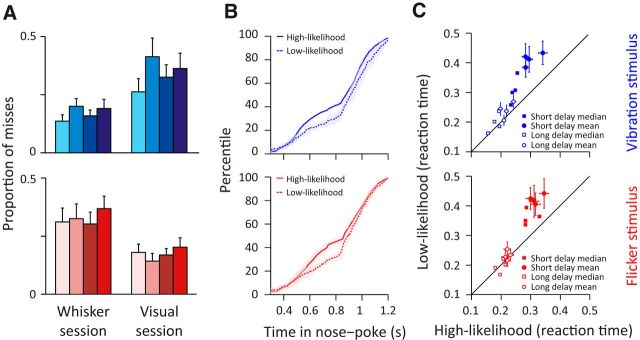
Figure 4.
Increased detection performance and speed when stimulus was presented in a high-likelihood versus low-likelihood session. A, Proportion of misses calculated as the number of miss trials divided by the sum of miss and hit trials. Top (blue), Miss proportion when vibration stimulus was presented in a whisker (high-likelihood trials) and visual session (low-likelihood trials). Bottom (red), Miss proportion when flicker stimulus was presented in a visual (high-likelihood trials) and whisker session (low-likelihood trials). Error bars indicate SDs for each rat. Color notations are the same as in Figure 2. B, Cumulative distribution frequency of nose-poke duration of hit and miss trials. Top (blue), Cumulative distribution frequency of vibration trials presented in high- (solid line) and low-likelihood session (dashed line). Bottom (red), Cumulative distribution frequency of flicker trials presented in high–likelihood session (solid line) and low-likelihood session (dashed line). Shaded area represents SD across rats. C, Scatter plot comparing reaction time between stimuli presented in high- and low-likelihood sessions for each rat. Trials were separated by short-delay stimulus (filled markers) and long-delay stimulus (open markers). Circles represent mean values. Squares represent median values. Error bars indicate SEMs.

