
Figure 4.
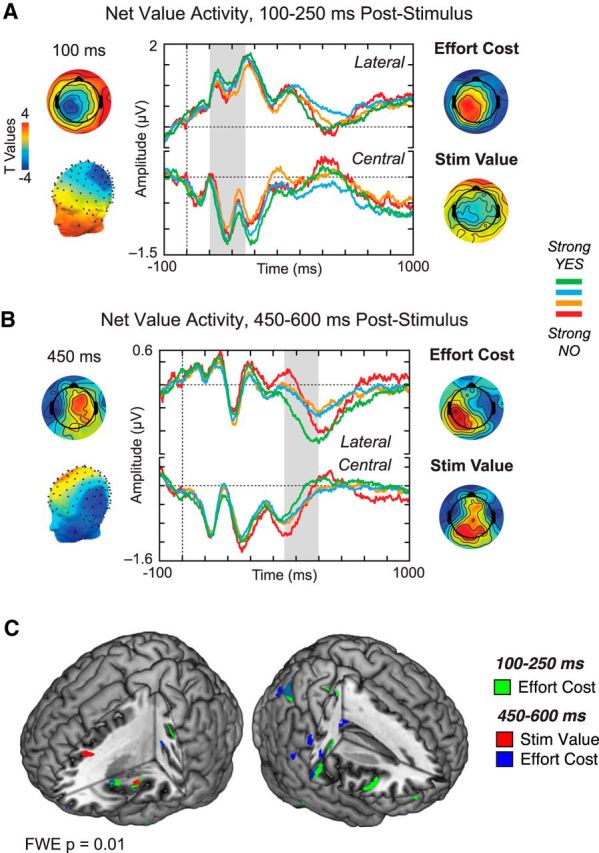
Net value scalp topography and average waveforms, stimulus-locked data. For ease of visualization, waveforms for decision value (strong no to strong yes) are depicted for SOIs selected from the net value comparison. A, Net value activity, 100–250 ms after stimulus. In line with the cluster analysis, scalp topography in this window appears to predominantly reflect effort cost (top right) rather than stimulus value (bottom right). B, Net value activity, 450–600 ms after stimulus. In this window, both effort cost and stimulus value appear to contribute to the topography of the net value response. C, Source localization of effort cost and stimulus value, FWE-corrected p < 0.01.