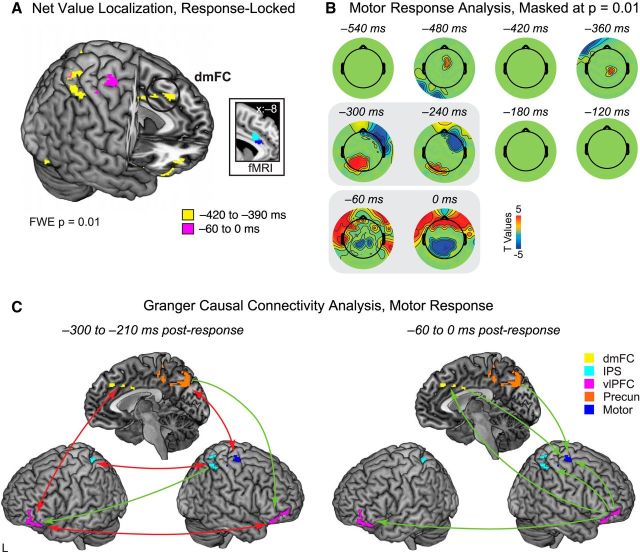
Figure 6.
Net value transformation into motor output, response-locked data. A, Source localization of net value activity from −420 to −390 ms (yellow) and −60 to 0 ms (magenta), FWE-corrected p < 0.01. Inset, Spherical masks based on peak coordinates from two fMRI studies [blue, Croxson et al. (2009); magenta, Prévost et al. (2010)], 6 mm radius. B, Sensors showing t values associated with linear ordering by motor response (pinky, ring finger, middle finger, index finger), masked by significance at p = 0.01. Major windows of motor activity were observed from −300 to −210 ms and −60 to 0 ms before response (gray boxes). C, GCCA of motor response activity for the significant time windows from −300 to −210 ms (left) and −60 to 0 ms (right) before response. ROIs were selected from sensorimotor areas identified in the net value localization in A; see also indicated clusters in Tables 5 and 6. Two-headed red arrows denote bidirectional connectivity, whereas green arrows indicate unidirectional connectivity. All causal connections shown here are significant at Bonferroni-corrected p = 0.05.

