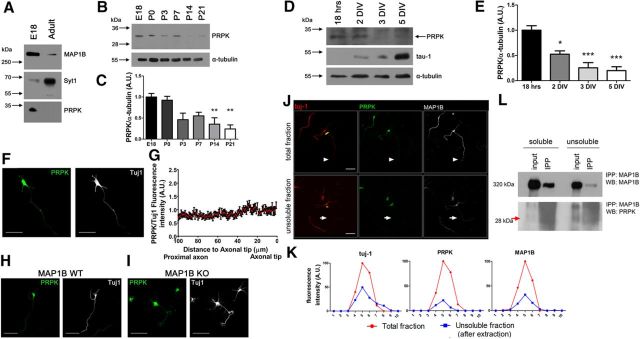
Figure 6.
Characterization of PRPK expression. A, PRPK expression levels were assessed by immunoblotting of E18 embryonic and adult whole rat brain protein extracts. MAP1B was used as an embryonic marker and Syt1 as an adult marker. B, PRPK postnatal expression pattern was evaluated by immunoblotting of whole rat brain protein extracts obtained between P0 and P21. An additional E18 embryonic time-point was included. C, Quantification of relative PRPK postnatal expression from B, (n = 3). Data expressed as the normalized ratio of PRPK to α-tubulin; one-way ANOVA with Dunnett's post-test (**p < 0.01). D, PRPK expression in cultured hippocampal neurons was determined by immunoblotting, between 18 h in vitro and 5 DIV. tau-1 epitope expression was also assessed, as it is a widely used axonal marker, and its relative abundance increases following culture maturation. E, Quantification of relative PRPK expression from cultured neurons in D (n = 3). Data expressed as the normalized ratio of PRPK to α-tubulin; one-way ANOVA with Dunnett's post-test (*p < 0.05, ***p < 0.001). F, Two DIV cultured hippocampal neuron stained with anti-PRPK and anti-Tuj1. Scale bar, 50 μm. G, Quantification of anti-PRPK fluorescence intensity along the last 100 μm of the axon as in F, standardized against anti-Tuj1 fluorescence intensity. The axon tip is toward the right. H, I, Cultured hippocampal neurons from MAP1B WT (H) or KO (I) embryonic brains at 2 DIV stained with anti-PRPK and anti-Tuj1. Scale bar, 50 μm. J, Hippocampal neurons stained with anti-(Tuj1, anti-PRPK, and anti-MAP1B. Control neurons (without extraction of the soluble tubulin fraction) are shown in the top, and the axon is indicated with arrowheads. Neurons in the bottom were subjected to extraction of the soluble tubulin fraction, and the axon is indicated with arrows. The yellow strips indicate the axonal region where the fluorescence intensity profile was analyzed. Scale bar, 50 μm. K, Fluorescence intensity profile for each probe in control neurons (total fraction, red line) and after extraction of the soluble fraction (insoluble fraction, blue line). L, Immunoprecipitation from 4 DIV WT neurons using antibody anti-MAP1B and blotting against PRPK. Protein extracts correspond to both soluble and insoluble fractions. The red arrow highlights the PRPK band.

