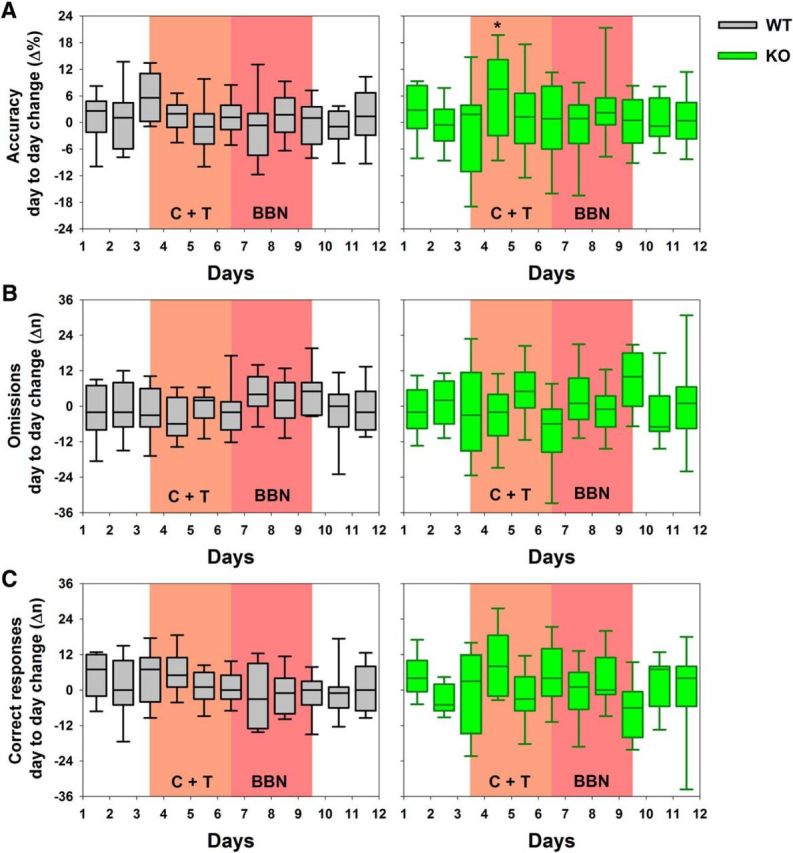
Figure 4.

C+T distractors induce changes in the day-to-day behavioral variability in KO mice. Genotype individual differences in consecutive days of the experimental protocol are illustrated as gray and green box plots for WT and KO mice, respectively (which show medians as the horizontal middle line and the first and third quartiles as the limits of the colored areas). Because box plots represent the change in behavioral performance between 2 d, these are plotted between days in the x-axis. A, Accuracy differences between consecutive days were uniformly distributed in WT mice, whereas a significant change in the upper limit of the IQR in the difference between days 5 and 4 was observed for KO mice (*) after the introduction of the C+T distractors. B, C, Although the IQR of the day-to-day differences between omissions and correct responses in KO mice were larger between days 4 and 3, the 95% CI of these values were not different from the WT 95% CI as assessed by a bootstrapped routine. Notice that the variability was similar in the three variables during the baseline period in both genotypes.
