Figure 7.

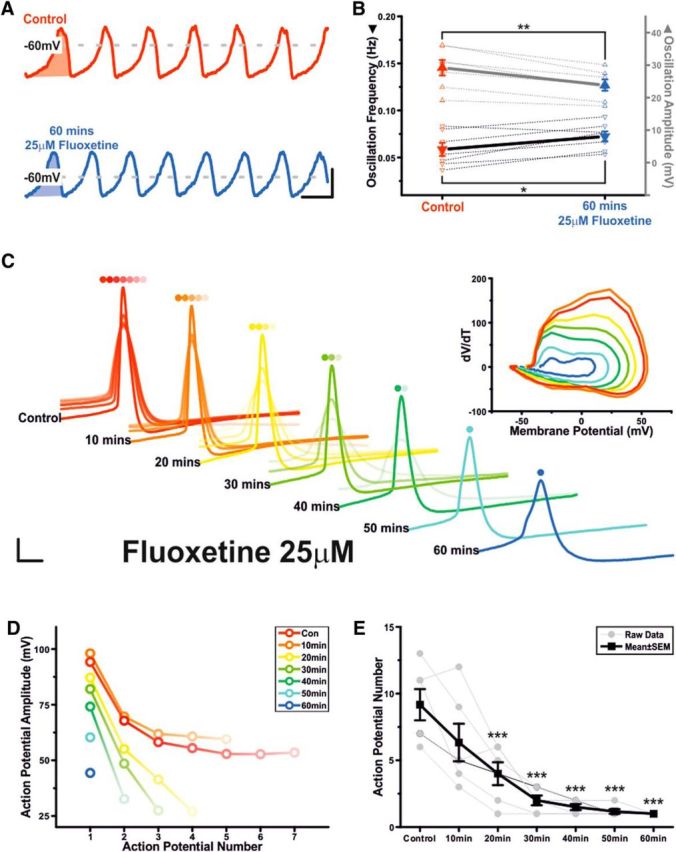
Clinically relevant concentrations of fluoxetine do not abolish the underlying TIDA oscillation but do inhibit TIDA neurons' capacity for repetitive discharge and reduce AP amplitude. A, Current-clamp trace of an oscillating TIDA neuron filtered at 1 Hz in control and following 60 min of 25 μm fluoxetine. Calibration 20 mV 20 s. B, Summary of fluoxetine-induced effects on oscillation amplitude (gray) and frequency (black). Thick lines indicate mean ± SEM. Dashed lines indicate raw data (n = 7). C, Peak aligned APs elicited in response to a square-form–positive current pulse during 60 min application of 25 μm fluoxetine. There is progressive reduction in AP number and amplitude. Calibration: 16 mV, 4 ms. Inset, Orbital plots of the first AP highlight change in threshold, amplitude, and rise and decay time. D, Plot showing AP number and amplitude data from the cell depicted in A. E, Fluoxetine progressively inhibits TIDA neurons' capacity for repetitive discharge. Thick lines indicate mean ± SEM. Thin lines indicate raw data (n = 6). *p < 0.05. **p < 0.01. ***p < 0.005.
