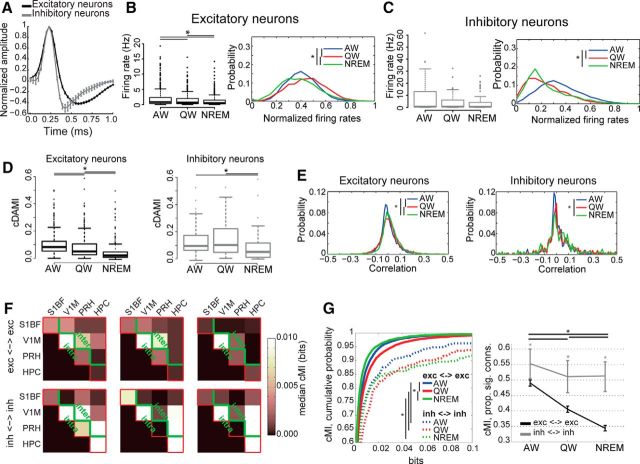
Figure 6.
Differential modulation of functional connectivity between excitatory and inhibitory neurons as a function of behavioral state. A, Average action potential waveforms (mean ± SEM) for neurons classified as either broad-spiking (putative excitatory neurons, black) or fast-spiking (putative inhibitory neurons, gray). B, Left, Firing rates for putative excitatory neurons across brain states. Asterisks indicate significant differences (p < 0.05, Friedman test with post hoc analysis). Right, Distribution of normalized firing rates for excitatory neurons only as a function of brain state (blue: AW, red: QW, green: NREM) computed using an 800 ms time bin. Firing rates within each brain state have been normalized (independently for each neuron) to the highest value recorded across all three brain states. Asterisks indicate significant differences between distributions across behavioral states (p < 0.05, Wilcoxon rank-sum test with post hoc analysis). C, Same as B but for inhibitory neurons. D, Boxplots of cDAMI for putative excitatory neurons (left, black) and putative inhibitory neurons (right, gray) as a function of behavioral state. For both excitatory and inhibitory neurons, cDAMI is weaker in NREM than in AW and QW, with cDAMI being larger in AW than QW for excitatory neurons (asterisks indicate p < 0.05, Friedman test with post hoc analysis). For all behavioral states, cDAMI was larger for inhibitory than for excitatory neurons (p < 0.05, Mann–Whitney U test). E, Probability distribution of pairwise linear correlation values between firing rate trains separately for all recorded excitatory (left) or inhibitory (right) neurons, across brain states (blue: AW, red: QW, green: NREM). Firing rates were computed using an 800 ms time bin. Asterisks indicate significant differences between distributions across behavioral states (p < 0.05, Kolmogorov–Smirnov test with post hoc analysis). F, Median cMI values within and between brain areas measured during a single recording session as a function of behavioral state. Red lines indicate the border between computed cMI values and empty portion of the matrix (see also Figure 3A). Top, Median cMI values between pairs of excitatory neurons. Bottom, Median cMI values between pairs of inhibitory neurons. Green lines indicate the boundary between intra-area and inter-area connections (below and above the green line, respectively). G, Left, Cumulative probability distribution curves of cMI values as a function of behavioral state for pairs of putative excitatory neurons (solid lines) and pairs of putative inhibitory neurons (dashed lines) pooled across all areas for different behavioral states (blue: AW, red: QW, green: NREM). Asterisks indicate significant differences (p < 0.05, Friedman test with post hoc analysis). Right, Proportion of connections significantly larger than 0 (p < 0.05) for the different types of neuronal pairs (black: pairs of excitatory neurons; gray: pairs of inhibitory neurons) as a function of behavioral state. Error bars indicate bootstrap-estimated confidence intervals (see Materials and Methods). Asterisks and lines at the top of each panel indicate significant differences across behavioral states (p < 0.05, bootstrap-estimated, only one asterisk for all lines); line colors and styles correspond to the connection to which they refer, as indicated in the legend; asterisks on top of error bars indicate significant differences between types of connections within each behavioral state.

