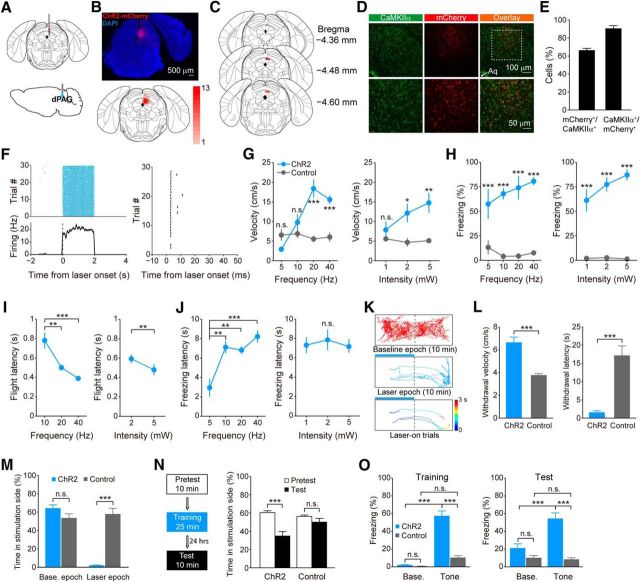
Figure 1.
Optogenetic activation of dPAG neurons evokes defensive behaviors. A, Schematic showing virus injection (top) and implantation of optical fiber (bottom) into the dPAG. B, Top, Visualization of ChR2-mCherry expression in the dPAG (DAPI, blue; ChR2-mCherry, red). Bottom, Overlay of virus expression (n = 13 mice). Color bar, the number of mice with virus expressed in that area. C, Placement of optical fiber tips (red circles; n = 13 mice). D, Top, Representative immunostaining images showing virally induced mCherry expression under the CaMKIIα promoter and endogenous CaMKIIα expression immunolabeled with anti-CaMKIIα antibody. Bottom, Higher-magnification images of the boxed area in the top panels. Arrowhead indicates aqueduct (Aq). E, Percentage of overlap between dPAG CaMKIIα+ and mCherry+ cells (n = 3 mice, 3 sections for each mice). F, Activity of an example unit in response to laser stimulation (blue shading; 5 mW, 20 Hz, 1 ms pulse). Left, Top, Spike raster, with each row corresponding to a single trial and each tick to a single spike. Left, Bottom, Peri-stimulus time histogram calculated by averaging firing rates across trials. Gray shading, SEM. Right, Spike raster showing latency following first laser pulse stimulation (3.07 ± 0.08 ms; mean ± SD). G, H, Velocity during photostimulation (G) and freezing percentage during ITI (H) at different pulse frequencies (power, 5 mW) and laser intensities (frequency, 20 Hz) in the ChR2 and control groups (n = 5 per group). Two-way ANOVA with Bonferroni's post hoc analysis. I, J, Latencies from laser stimulation to flight (I) and freezing (J) onset at different pulse frequencies (power, 5 mW) and laser intensities (frequency, 20 Hz) in the ChR2 group (n = 5). I, Left, One-way ANOVA, F(2,8) = 18.89, p = 0.0009, Tukey's post hoc. I, Right, Paired t test, t(4) = 4.659, p = 0.0096. J, Left, One-way ANOVA, F(3,12) = 12.06, p = 0.0006, Tukey's post hoc. J, Right, One-way ANOVA, F(2,8) = 0.3364, p = 0.7239, Tukey's post hoc. K, Locomotion tracks of a representative ChR2-expressing mouse during real-time place-aversion test. Blue bar, Laser delivery; color bar, time; time 0, laser onset. L, Withdrawal velocity (left, t test, t(8) = 5.9824, p < 0.001) and withdrawal latency (right, t test, t(8) = −5.8712, p < 0.001) in response to laser illumination in the real-time place-aversion test in the ChR2 and control groups (n = 5 per group). M, Percentage of time spent in stimulation chamber during baseline and laser epochs in the ChR2 and control groups (group × epoch interaction, F(1,8) = 66.74, p < 0.001; two-way ANOVA, Bonferroni's post hoc.; n = 5 per group). N, Schematic of conditioned place-aversion test (left). Time that ChR2 (n = 8) and control (n = 7) groups spent in the stimulation-paired chamber on the pretest and test days (right; group × day interaction, F(1,13) = 10.24, p = 0.007; two-way ANOVA, Bonferroni post hoc). O, Freezing percentage during the baseline and tone presentation periods on the training (F(1,18) = 55.35, p < 0.0001) and test (F(1,18) = 21.31, p = 0.0002) days in the ChR2 and control groups (two-way ANOVA, Bonferroni's post hoc.; n = 10 per group). On both the training and test days, the ChR2 group showed significantly higher level of freezing during tone presentation compared with the baseline period (p < 0.0001 for training day; p < 0.0001 for test day; two-way ANOVA, Bonferroni's post hoc.) and the control group (p < 0.0001 for training day; p < 0.0001 for test day; two-way ANOVA, Bonferroni's post hoc.). Error bars, SEM; n.s., nonsignificant, p > 0.05; *p < 0.05; **p < 0.01; ***p < 0.001.

