Figure 3.

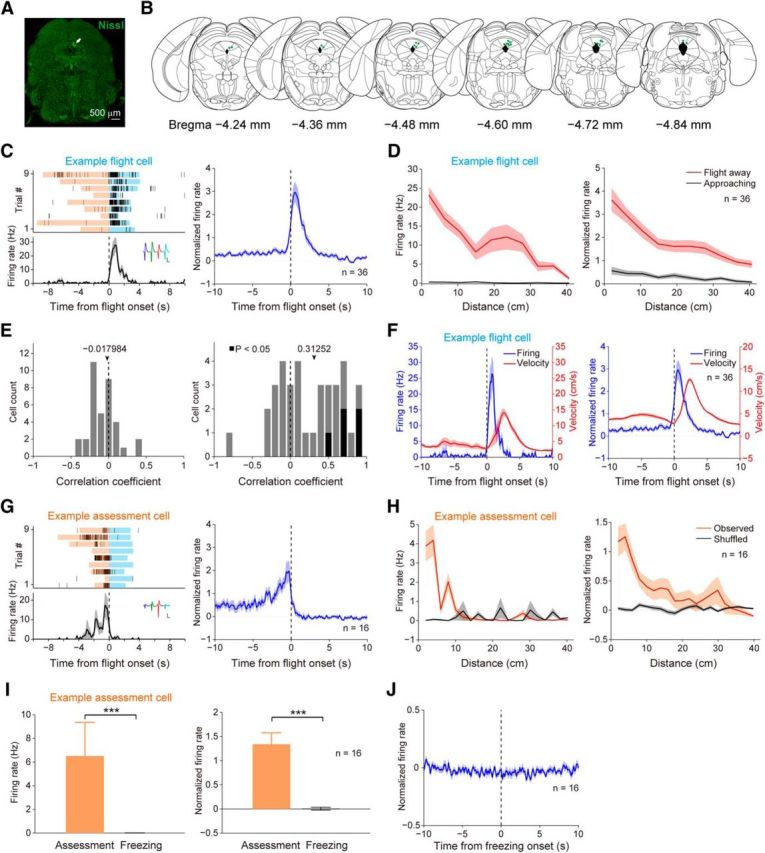
Activities of units recorded in the dPAG during defense. A, Fluorescent Nissl staining showing an electrolytic lesion site (white arrow). B, Summary of electrode recording sites (green dots). C, Left, Example of a flight cell. Trials were aligned to flight onset. Blue shading, Flight episode; orange, risk-assessment episode. Inset, Spike waveforms. scale bars: 100 μV, 500 μs. Right, Normalized average PETH across all 36 flight cells. D, Firing rate of an example flight cell (left; same cell in C, left) and normalized average firing rates of all flight cells (right) plotted as a function of distance to the wire mesh. Red, Running away from the wire mesh. Black, Running toward the wire mesh. E, Left, Distribution of correlation coefficients (Pearson's r) between instantaneous velocity and firing rates of flight cells during flight period. Right, Distribution of correlation coefficients (Pearson's r) between maximum flight velocity and mean firing rates of flight cells during each flight episode. Black bars indicate significance (Pearson's p < 0.05); gray bars indicate no significance. F, Left, Firing activity of an example flight cell (same cell in C, left) and the mouse's instantaneous velocity during flight. Right, Normalized average firing activities of flight cells and the corresponding instantaneous velocity during flight. G, Left, Example of a risk-assessment cell. Inset, Spike waveforms. Scale bars: 100 μV, 500 μs. Right, Normalized average PETH across all 16 assessment cells. H, Firing rate of an example assessment cell (left; same cell in G, left) and normalized average firing rates of all assessment cells (right) plotted as a function of distance to the wire mesh. Orange, Observed data. Black, Shuffled data. I, Average firing rate of an example assessment cell (left; Wilcoxon rank-sum test, ***p < 0.001; same cell in G, left) and normalized average firing rates of all assessment cells (right; Wilcoxon signed-rank test, ***p < 0.001) during risk assessment and freezing episodes. Error bars, SEM. J, Normalized average PETH aligned to freezing onset across all 16 assessment cells.
