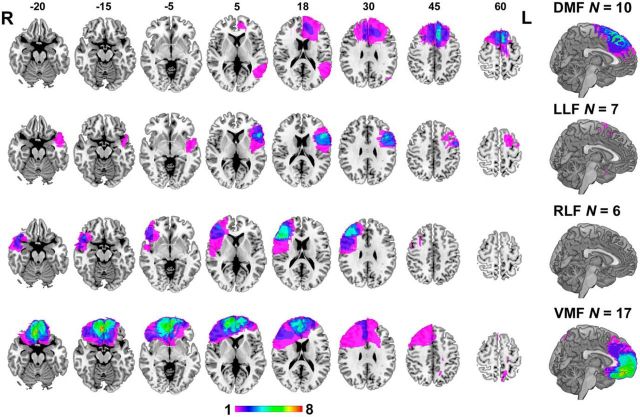
Figure 1.
Representative axial slices and sagittal view of overlap of lesion tracings on the MNI brain. Rows show overlap in the DMF, LLF, RLF, and VMF groups. Numbers above slices indicate z coordinates of axial section in MNI space. Colors indicate number of subjects with overlapping lesions, as indicated by the color bar. L, Left; R, right.

