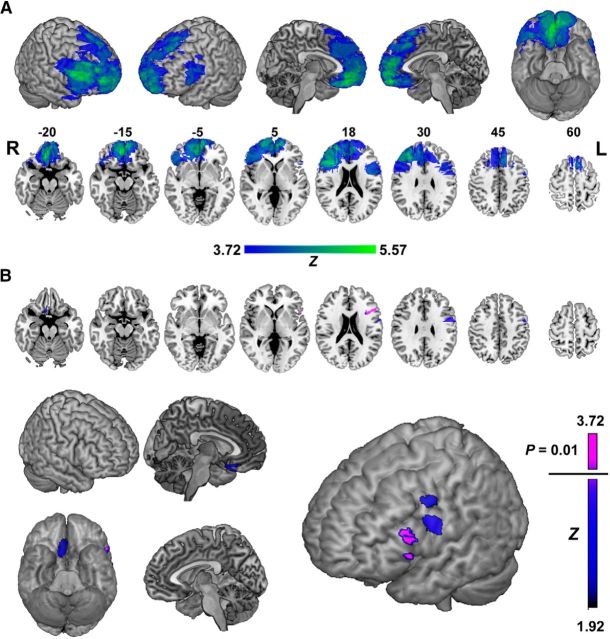
Figure 7.
VLSM analysis. A, Power map of voxels with sufficient lesion overlap for VLSM methods. The color scale indicates the maximum possible Z-score detectable at a given voxel, an indication of the power for detecting effects. Top row shows this map overlaid on the MNI brain in three-dimensional views. Bottom row shows representative axial slices. Numbers above the axial slices correspond to z-coordinates in MNI space. R, Right; L, left. B, VLSM statistical map for increased win–stay behavior in the color dimension overlaid on MNI brain in axial slices (top) and three-dimensional views (bottom). Color scale indicates Brunner–Munzel Z scores. Voxels in pink represent where significant effects were found at p = 0.01, permutation corrected.

