Figure 1.
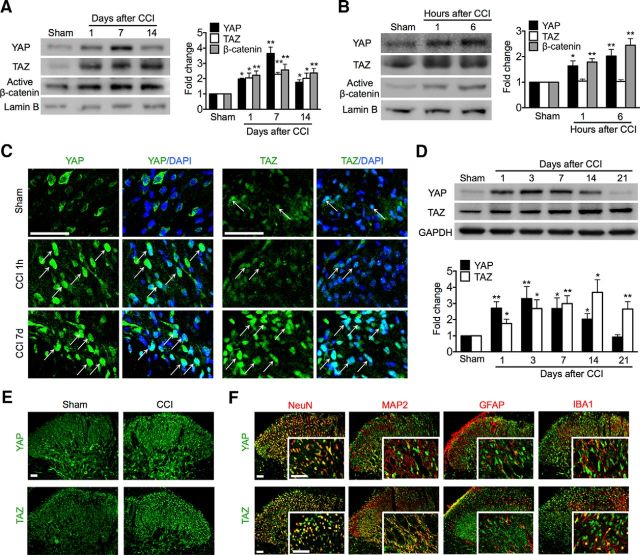
Nuclear accumulation of YAP/TAZ/β-catenin and expression and cellular distribution of YAP/TAZ in the spinal dorsal horn after CCI. A, B, Western blot showing nuclear expression of YAP/TAZ/β-catenin in the long (A) and short (B) time course (n = 4 in each) after CCI. One-way ANOVA (A) YAP: p < 0.0001, F = 24.81; TAZ: p = 0.0111, F = 5.766; (B, C) p = 0.0072, F = 6.548; (B) YAP: p = 0.0116, F = 7.609; TAZ: p = 0.8791, F = 0.1397; (B, C) p = 0.0007, F = 18.12. (A, B) *p < 0.05, **p < 0.01 versus sham. C, Immunofluorescence showing nuclear (DAPI, blue) expression of YAP/TAZ (green) in the superficial dorsal horn. Arrows indicate nuclear expression of YAP or TAZ. D, Western blot showing time course of protein expression of YAP (n = 5) and TAZ (n = 4). One-way ANOVA followed by t test. YAP: p < 0.0014, F = 6.107; TAZ: p = 0.0061, F = 5.127. *p < 0.05, **p < 0.01 versus sham. A–D, Tissues were taken on the multiple time points as indicated. E, Overall distribution of YAP/TAZ. F, Tissues were taken on day 7 and cellular colocalizations of YAP/TAZ after CCI. Top, YAP (green) was predominantly colocalized with neuronal somata (NeuN, red), but not with dendrites (MAP2, red), astrocytes (GFAP, red), or microglial cells (IBA1, red). Bottom, TAZ (green) was mostly colocalized with NeuN and MAP2 and IBA1, but not with GFAP. Tissues were taken on day 7. Original magnifications: 1200× (C), 200× (E, F), and 800× (inserts in F). Scale bar, 50 μm.

