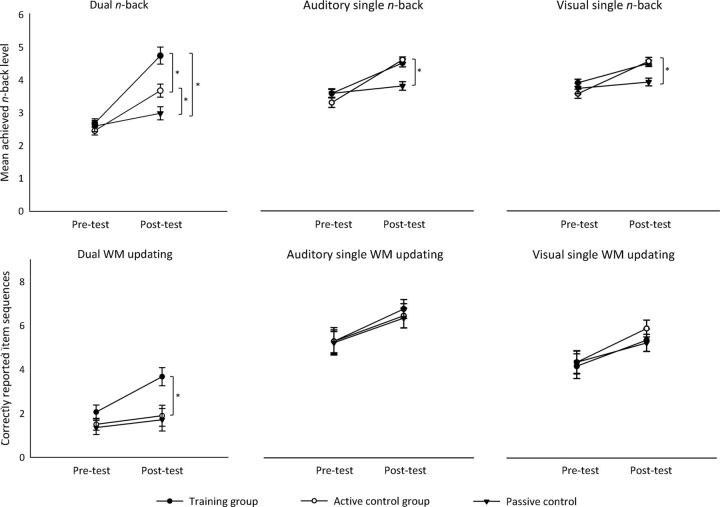
Figure 2.
Top, Improvement in the performance of all groups from pretest and posttest in the dual n-back task (left), the auditory single n-back task (middle), and the visual single n-back task (right). For each session, the mean n-back level is presented. Error bars indicate SEM. An asterisk indicates a significant difference between the groups. Bottom, Improvement in the performance of all groups from pretest and posttest in the dual WM updating task (left), the auditory single WM updating task (middle), and the visual single WM updating task (right). For each session, the number of correctly reported item sequences is presented. Error bars indicate SEM. An asterisk indicates a significant difference between the groups.

