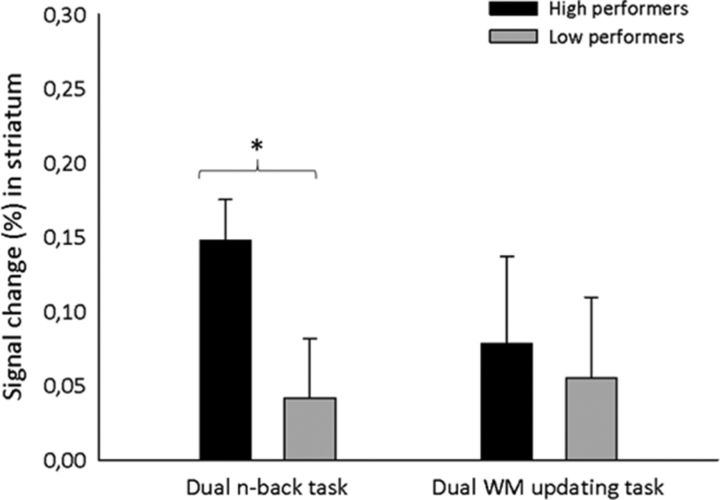
Figure 8.
Change from pretest to posttest in striatal percentage activation change depicted separately for the highest (15%) and lowest (15%) scoring participants from the training group in the dual n-back task (left) and the dual WM updating task (right). An asterisk indicates a significant difference between the groups. Error bars indicate SEM.

