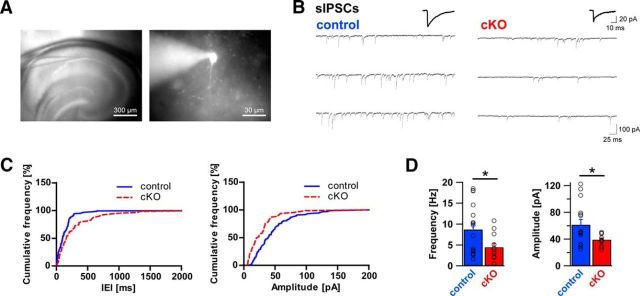
Figure 9.
Frequency and amplitude of sIPSCs are reduced in dystroglycan cKO pyramidal cells. A, Position of the recording pipette in the hippocampal CA1 region (left, 4×), and an example of a typical CA1 pyramidal cell identified using LED illumination (AlexaFluor-488, right, 40×). B, Representative example traces of whole-cell sIPSC recordings from control mice (left) and DG cKO mice (right). Average sIPSCs are shown above the traces. C, Cumulative frequency plot of IEIs of sIPSCs from control (blue line) and DG cKO cell (red line) from the traces in B (left) and cumulative frequency plot of sIPSC amplitudes from the same cells (right). D, Comparison of average sIPSC frequency and amplitude between control and DG cKO slices. DG cKO mice exhibit significantly lower sIPSC frequency and amplitude than control mice. Data points represent individual cells. *p < 0.05.

