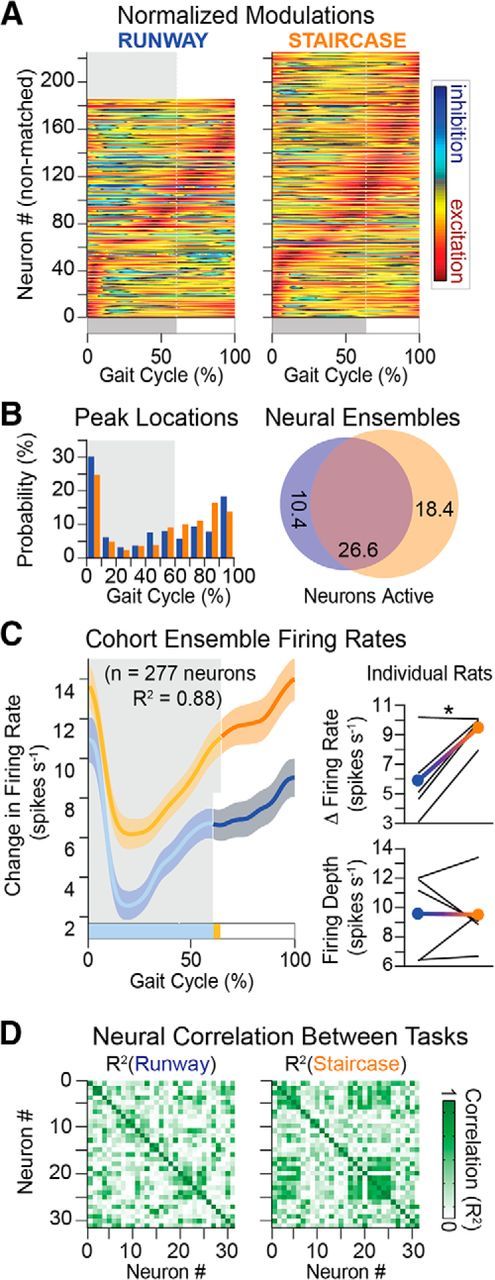
Figure 11.

Neuronal population responses during locomotion along a runway and onto a staircase. A, Average modulation of active neuron over the duration of the gait cycle (n = 5 rats). Conventions are the same as in Figure 4. B, Distribution of peak firing rates and Venn diagrams, as shown in Figure 4. C, Ensemble firing rate (mean ± SEM) computed from all active neurons in both behaviors. Right, Mean firing rate and depth of modulation for the cohort (filled circles) and individual rats (black lines). D, Cross-correlation between neurons is shown for a representative rat. Cross-correlation between firing rates of active neurons for a rat. Average cross-correlation was significantly higher (n = 4767 pairs; p < 1 × 10⁻⁵) on the stairs (R2 = 0.29) than the runway (R2 = 0.23). One-way ANOVA, F(2,14298) = 61, p < 1 × 10⁻¹⁰, post hoc testing with Bonferroni correction p < 1 × 10⁻¹⁰ (runway vs stairs). *p < 0.05 (Student's t test).
