
FIG 1.
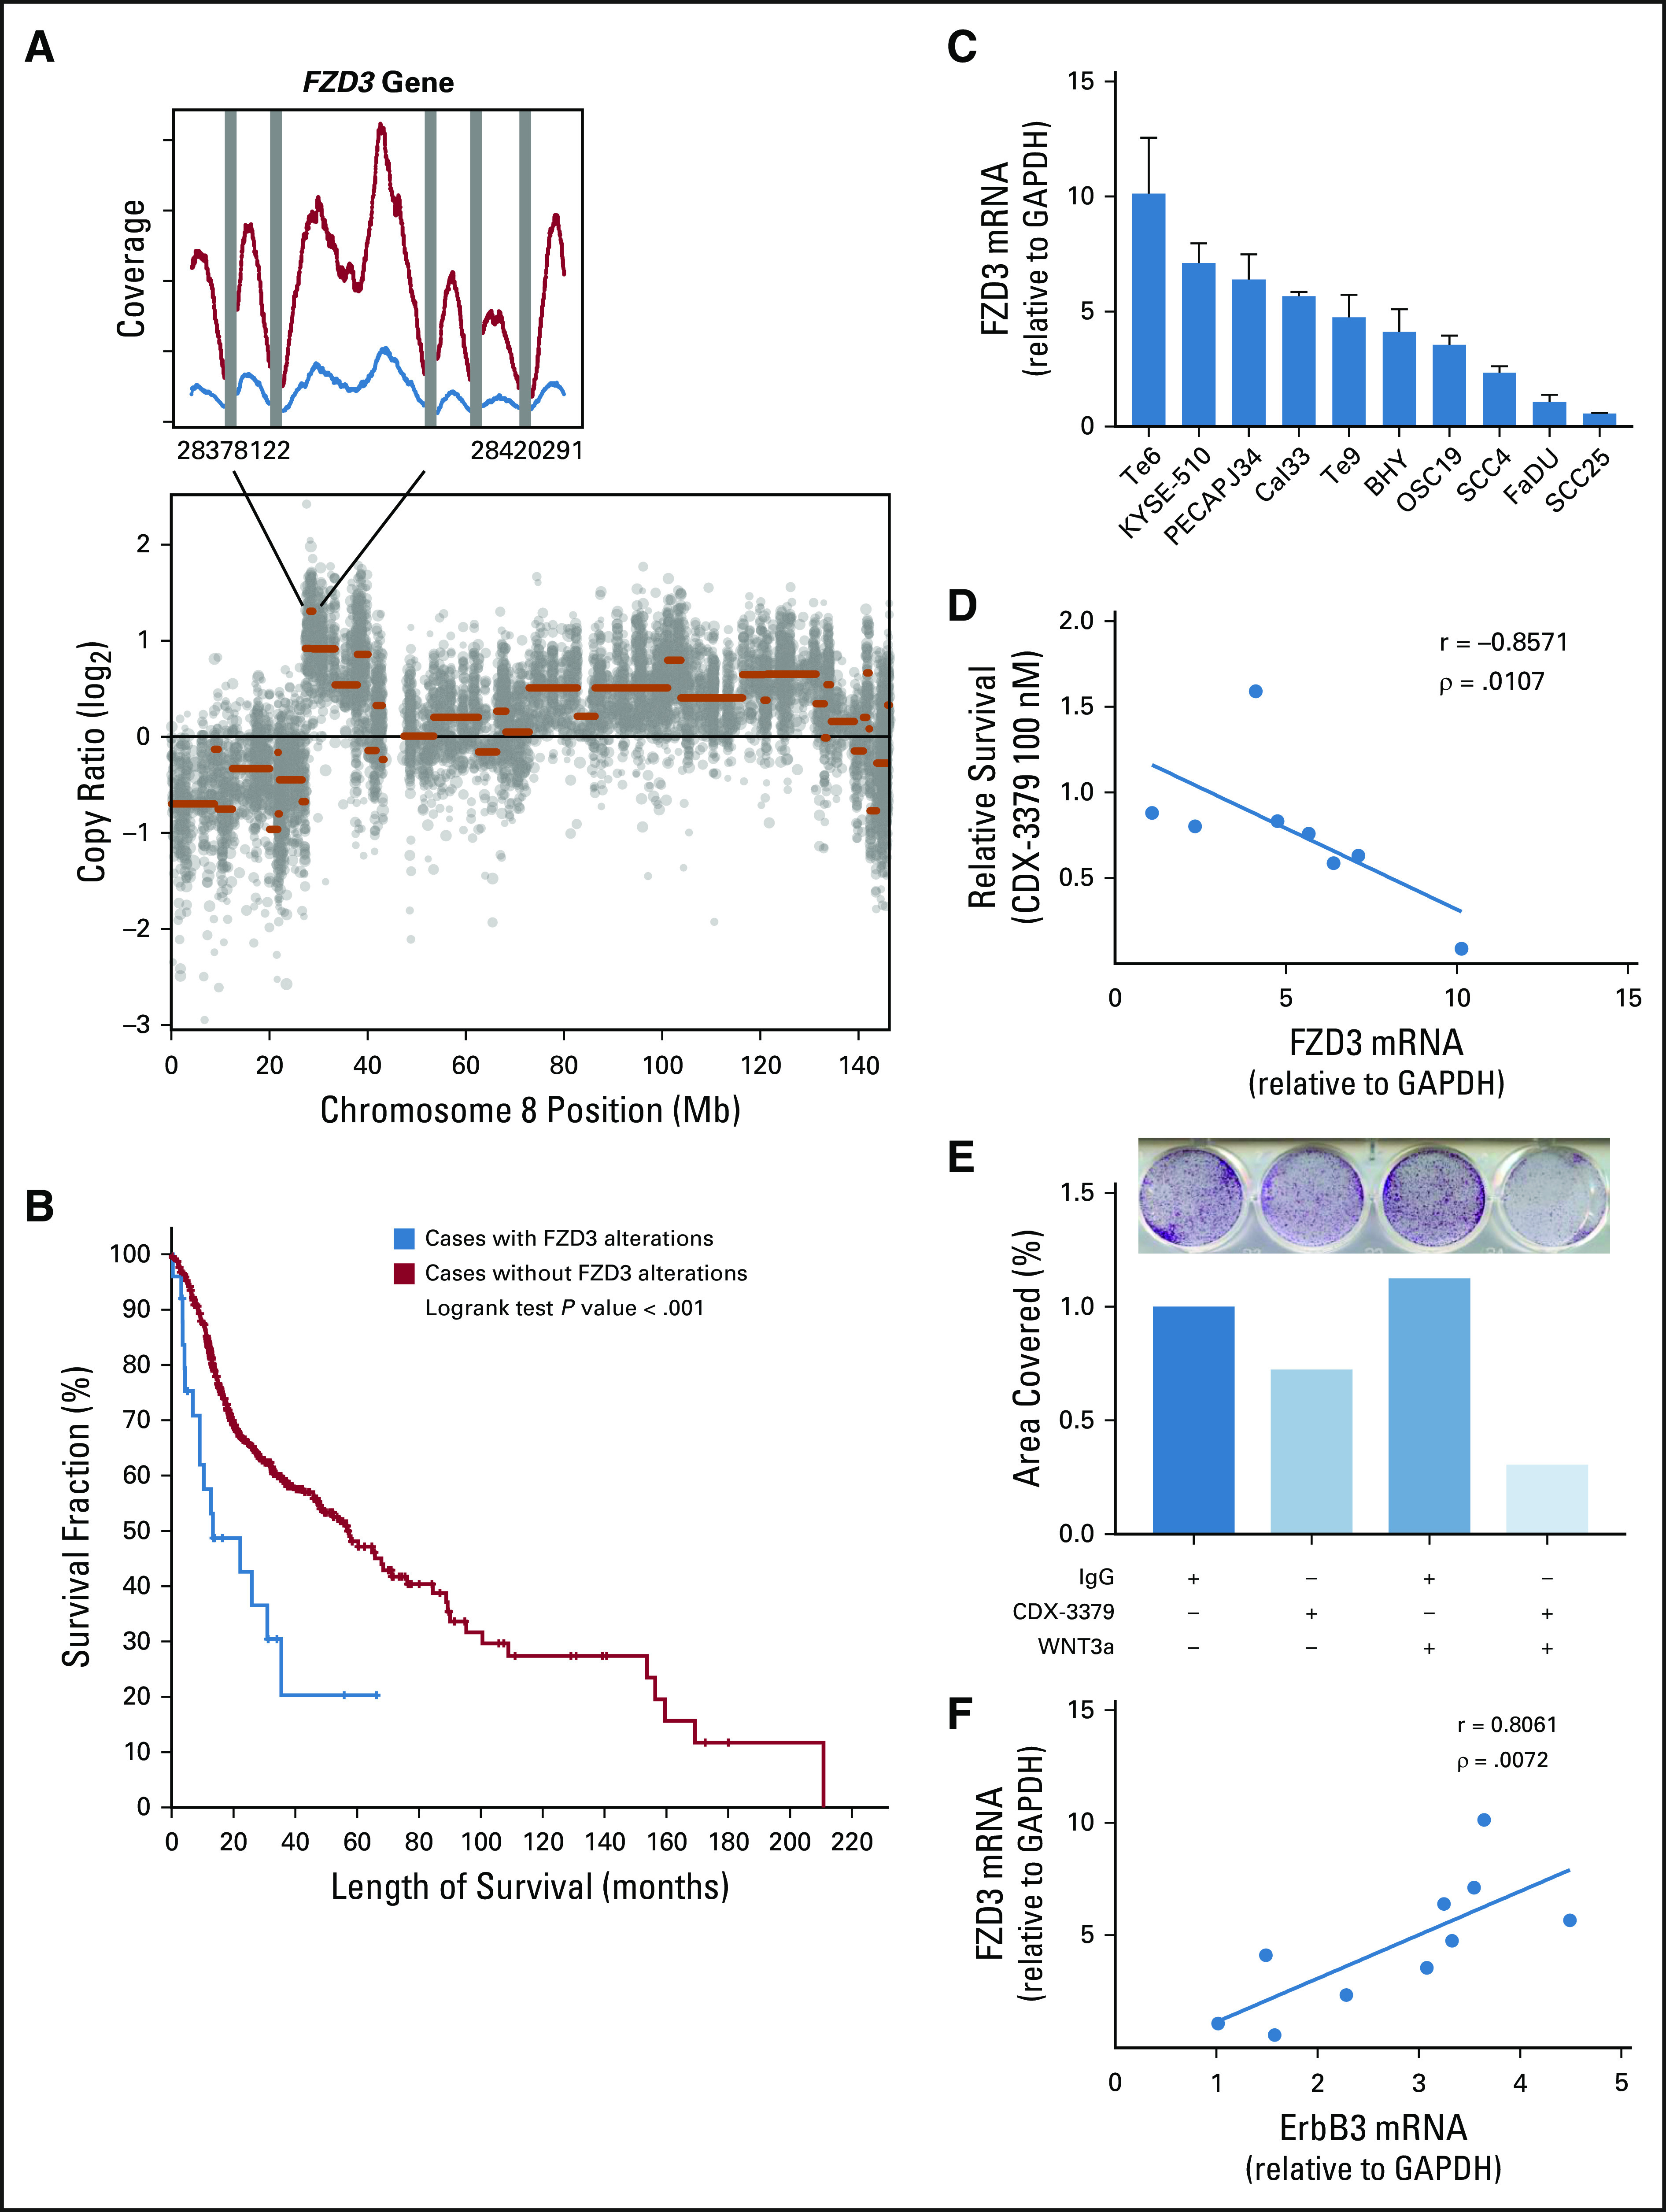
FZD3 in head and neck squamous cell carcinoma (HNSCC). (A) Chromosome 8 copy number variant plot and identified FZD3 gene amplification in pretreatment tumor.(B) Kaplan-Meier curve demonstrating worse survival in patients with HNSCC in The Cancer Genome Atlas whose tumors possess FZD3 amplification, deletion, or mRNA upregulation (red) compared with patients whose tumors do not have FZD3 alterations (blue; log rank P < .001). (C) FZD3 mRNA expression is variable among 10 HNSCC cell lines. (D) Negative correlation between FZD3 mRNA expression levels in HNSCC cell lines and survival in colony formation in the presence of CDX-3379 relative to IgG (Spearman correlation coefficient −0.86, P = .01). (E) CDX-3379 growth inhibition is potentiated in Te6 cells by the addition of Wnt3a. Images of a representative colony formation (top) with quantification of stained area represented in bar graph (middle) and culture additives (bottom) P < .001 for all comparisons by one-way analysis of variance. (F) Positive correlation between FZD3 and ErbB3 mRNA expression levels in HNSCC cell lines (Spearman correlation coefficient 0.81, P < .01).