
Fig 5.
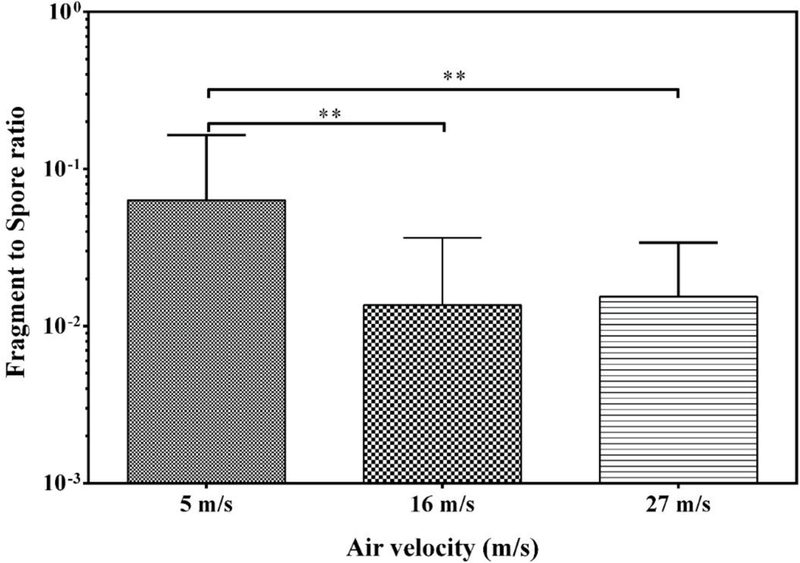
Fragment/spore-ratio obtained at three air velocities at 1 month of cultivation. The bars represent the geometric means of data from all species and materials combined, n= 9. The error bars represent the geometric standard deviations. Asterisks indicate the level of statistical significance (**, p < 0.01).