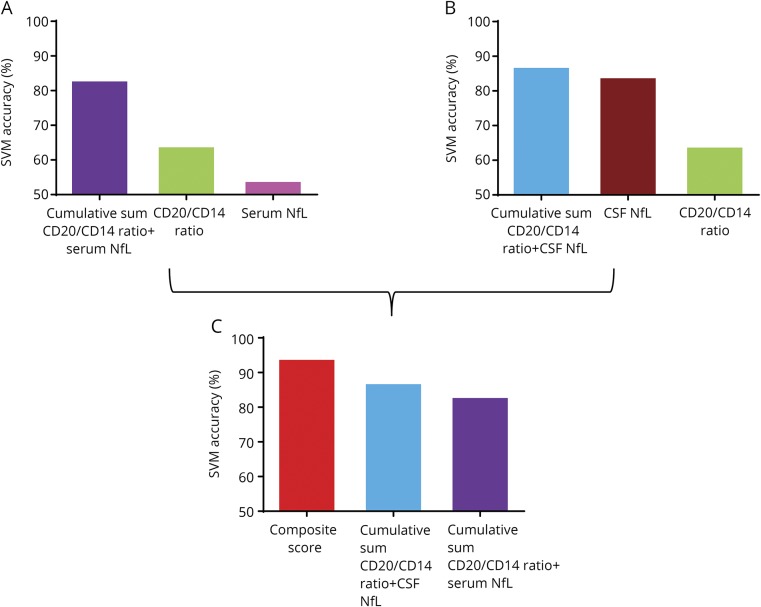
Figure 5. SVM analysis for each biomarker and their combinations.
(A) Bar diagram represents SVM accuracy of CSF CD20/CD14+ ratios and serum NfL levels and the cumulative sum of these 2 biomarkers as a measure of biomarker performance. (B) Bar diagram represents SVM accuracy of CSF CD20/CD14+ ratios and CSF NfL levels and the cumulative sum of these 2 biomarkers. (C) Bar diagram represents SVM accuracy of the cumulative sums (CD20+/CD14+ ratio + serum NfL and CD20+/CD14+ ratio + CSF NfL) and the derived composite score. NfL = neurofilament light chain; SVM = support vector machine.

