Figure 2.
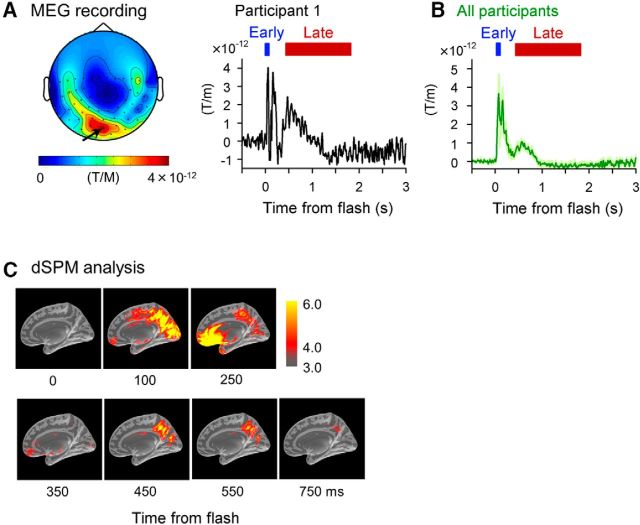
A flash of light induces a late response in the human occipital cortex. A, Left, Topographical plot of the MEG response in the occipital channels. Representative data from a single participant are shown. Color indicates the intensity of the signal at 40–65 ms after the flash. Right, Time course of the MEG signal recorded in the occipital channel shown by the arrow. Data represent the means of 120 trials. B, Average ± SD time course data of the most active occipital channel across all eight participants. Periods indicated in red represent the time point at which the signal increased significantly compared with the period before the flash (p < 0.05, FDR corrected). C, dSPM analysis using the average MEG signal recorded from eight participants.

