
Figure 3.
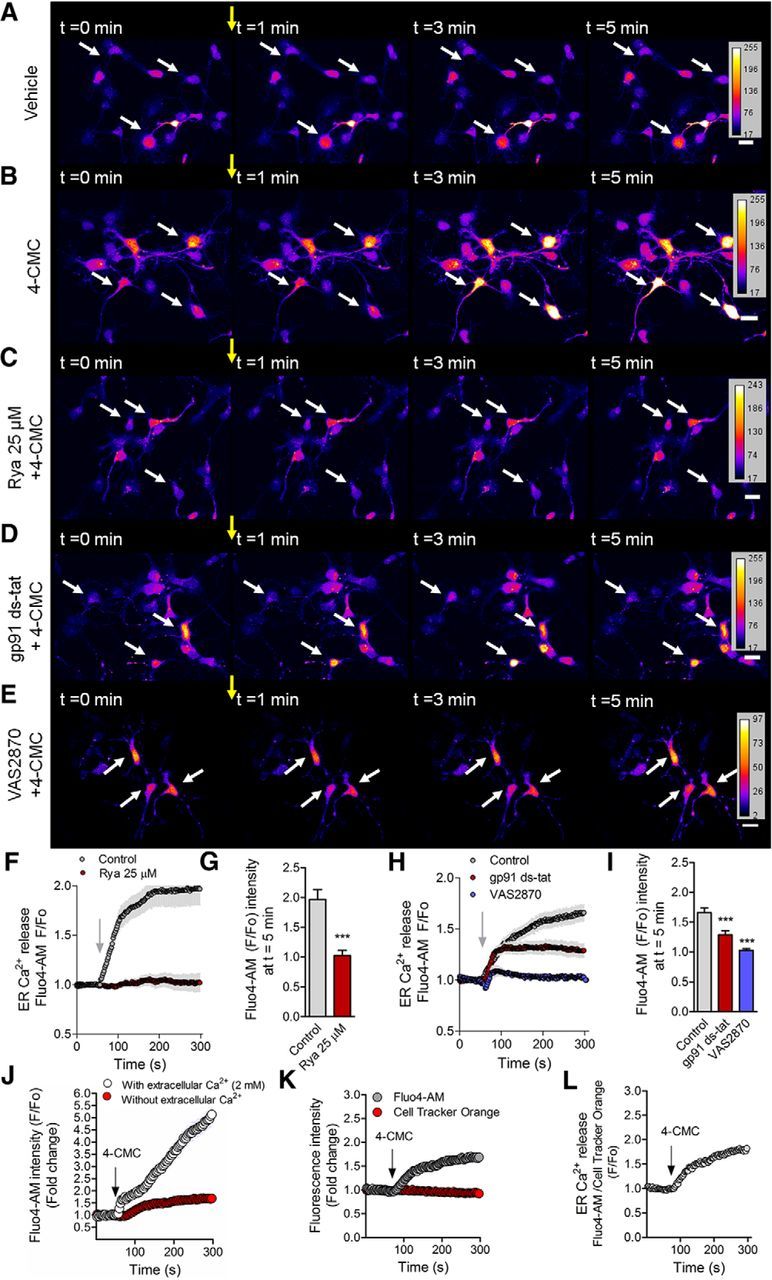
Functional coupling between NOX and RyR-mediated Ca2+ release. Neurons (2 DIV) were loaded with Fluo4-AM to visualize cytosplasmic Ca2+ in live neurons. A–E, Representative time-lapse imaging for the vehicle of 4-CMC (ethanol; A), 4-CMC (750 μm; B), and neurons pretreated with ryanodine (25 μm; C), gp91 ds-tat (5 μm; D), and VAS2870 (5 μm; E) for 1 h before 4-CMC addition. F, Quantification of RyR-mediated Ca2+ release of B and C. G, Quantification of the F/F0 ratio at t = 5 min of F. ***p < 0.001 versus control, Student's t test. H, Quantification of RyR-mediated Ca2+ release after 4-CMC stimulation in control, gp91 ds-tat (5 μm), and VAS2870 (5 μm) of B, D, and E. I, Quantification of the F/F0 ratio at t = 5 min in control of H. ***p < 0.001 versus control, ANOVA, Dunnett's post test. J, Fluo4-AM fluorescence after 4-CMC stimulation in Ca2+-free or Ca2+-containing medium (2 mm) during the recording of Ca2+ signals. K, Fluo4-AM and Cell Tracker Orange (volume control) fluorescence before and after 4-CMC stimulation in 2 DIV neurons. L, Normalization of the Fluo4-AM signal by Cell Tracker Orange fluorescence during the recording. Results are from 3 different independent cultures (n = 3). A total of 60 neurons were analyzed for each condition. Scale bar, 20 μm.