Figure 8.
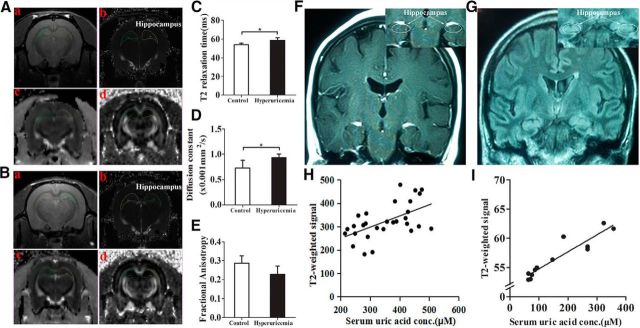
MRI-based quantitative assessment of hippocampal gliosis in rats and humans with hyperuricemia. A, B, Regions of interest (circles) and representative images of the normal rats (A) and rats with hyperuricemia (B). Aa–Bd, High-resolution, two-dimensional rapid acquisition (Aa, Ba); T2 map generated from a multiecho sequence (Ab, Bb); DTI for tensor trace measurement (Ac, Bc); and DTI for fractional anisotropy (Ad, Bd). C–E, Results of multiparametric quantitative assessment in rats with hyperuricemia and chow-fed rats, including T2 relaxation time (C), tensor trace (D), and fractional anisotropy (E; Student's t tests, *p < 0.05 vs control, n = 6 rats per group). F, G, Representative coronal T2 FLAIR images to diagnose FES through the hippocampus in a subject with normal serum UA levels (F) and a subject with hyperuricemia (G). Insets show the placement of ROIs (white circles) in the hippocampus. H, The concentration-dependent correlation between serum UA levels and hippocampus gliosis in humans (n = 29 subjects; r = 0.311). I, The concentration-dependent correlation between serum UA levels and hippocampus gliosis in rats (n = 12 rats; r = 0.871). All displayed values are the mean ± SEM.

