Figure 10.

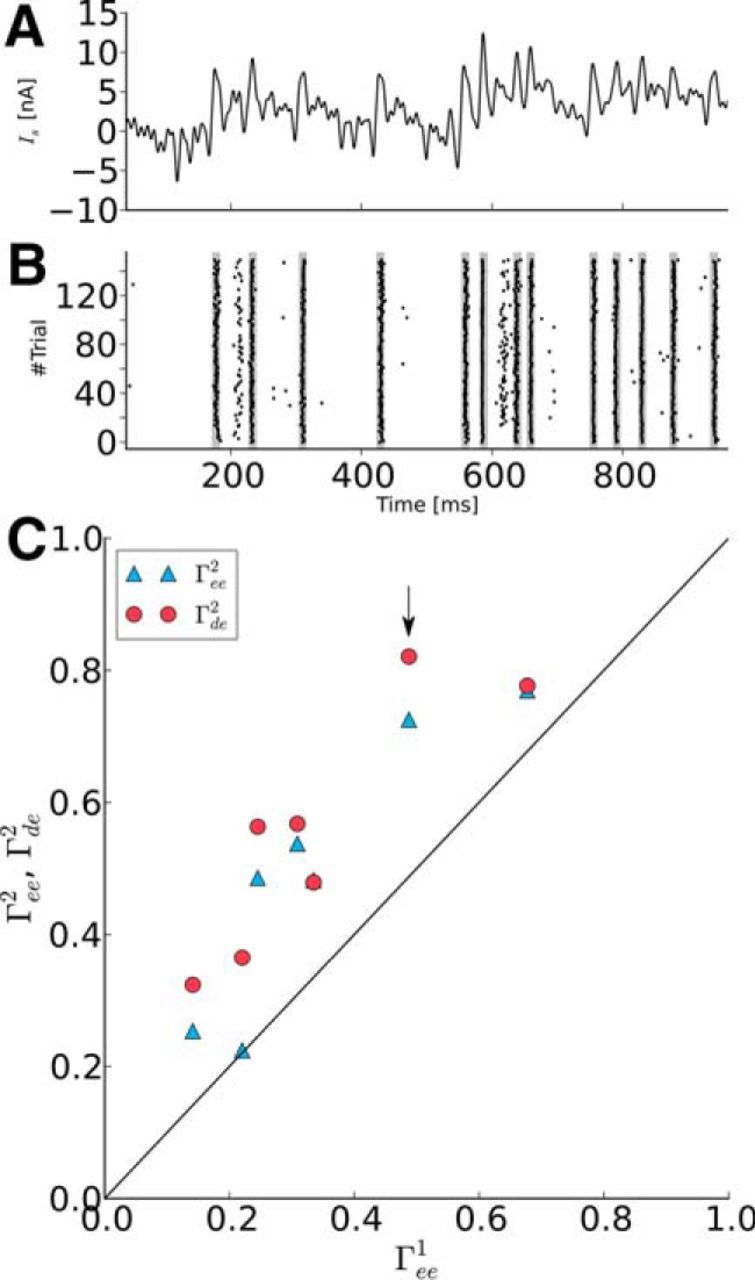
Prescribed spike times can be evoked reliably in vivo. A, Example stimulus calculated to evoke a desired spike train in a particular cell. B, Raster plot of spike trains (black dashes) generated by stimulation with the current shown in A. The desired spike times are marked as gray stripes in the raster plot and align precisely with the evoked spike times. C, The trial-to-trial reliability in phase 2 (Γee2) (blue filled triangle symbol) and the similarity between trials and desired spike train (Γde2) (red filled circle symbol) are plotted against the trial-to-trial reliability in phase 1 (Γee1). In phase 2, spike trains were more reliable than in phase 1. The similarity between trials and desired spike train Γde2 even exceeds the trial-to-trial reliability Γee2. The arrow marks the cell shown in B. Note that, for one point, the two symbols overlap.
