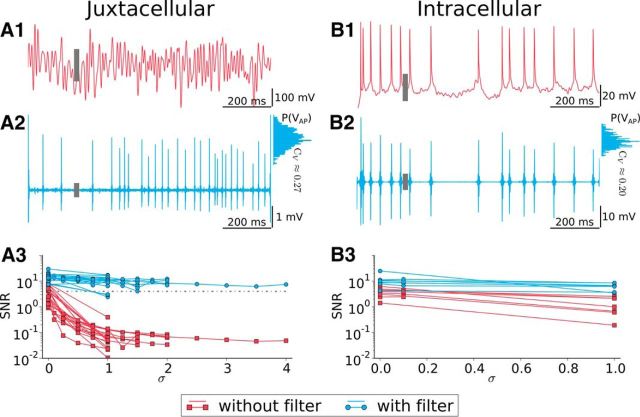
Figure 2.
Spike extraction is reliable in noisy juxtacellular stimulation and comparable to spike detection in intracellular recordings. A1, Juxtacellular recording trace with 100 Hz broadband stimulation. The gray bar denotes the SD of the voltage trace. A2, Filtered voltage (gray bar is SD). Histogram at the right shows the distribution of the spike height, with the relative broadness characterized by its SD-over-mean ratio, CV. A3, SNR versus input fluctuations. Red indicates the SNR for raw data; blue, SNR for filtered voltage. The dashed line indicates SNR = 4, taken as our significance level. B1–B3, Same as in A1–A3 but for an intracellular recording.

