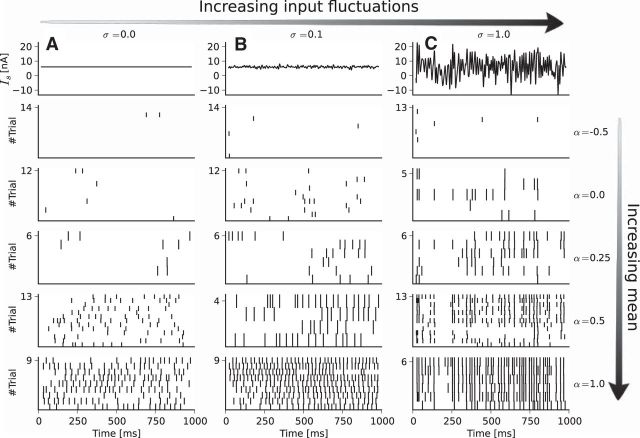
Figure 4.
Firing rate increases with mean input (scaled by α), synchrony increases with SD of stimulus (scaled by σ). A, Constant input current (top row) and raster plots (bottom rows) for increasing α(−0.5, 0, 0.25, 0.5, 1). B, Same as A but with fluctuating input with σ = 0.1. C, Same as A but σ = 1. This is an example of the data recorded for one stimulus waveform for a single cell from motor cortex.

