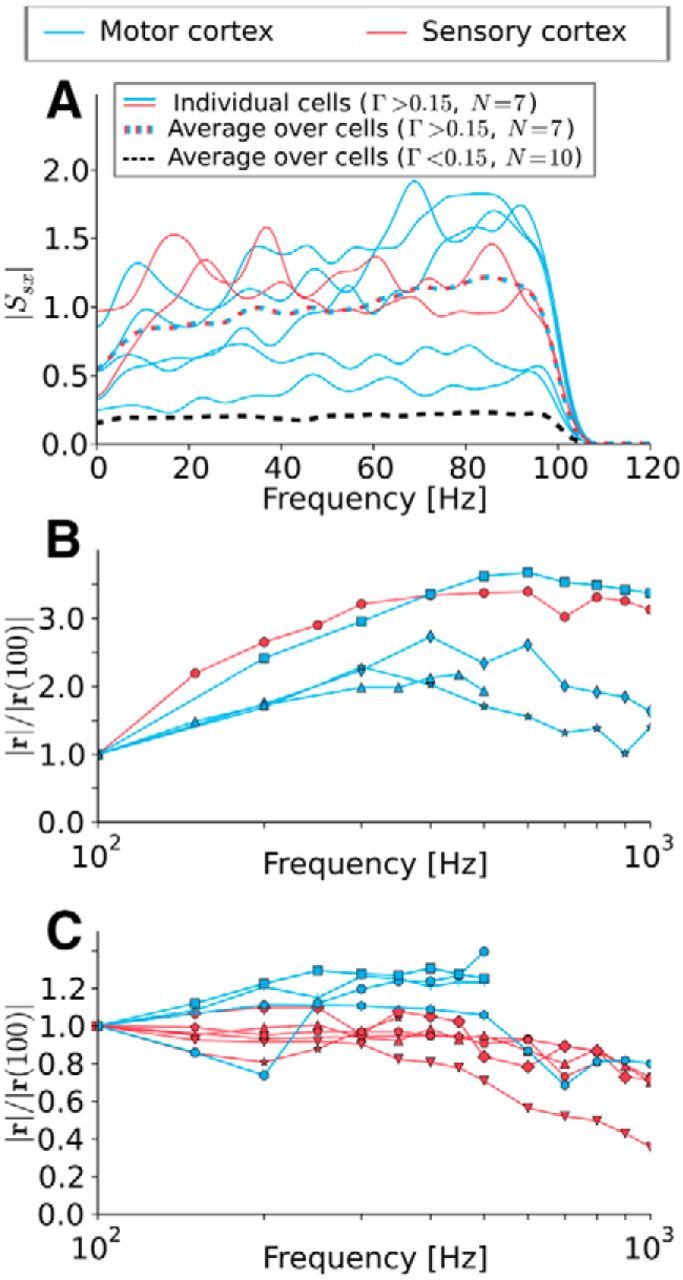
Figure 6.

Neurons can track the stimulus up to very high frequencies. A, Absolute values of the stimulus—spike-train cross-spectrum |Ssx|. Solid lines are individual recordings, dashed lines are ensemble averages. The black dashed line can be interpreted as noise floor. The curves with significant coincidence (Γ > 0.15) increase or are constant up to the stimulus cutoff frequency. B, C, Absolute value of the vector strength for different cells driven with pure cosine stimuli. Both figures show the same statistics, but the dataset is split into cells that show clearly increasing vector strength (B) and those that do not (C). Note the different scales between B and C. In both cases, no clear cutoff can be seen up to 1000 Hz. This implies that the neurons are able to track fast stimuli changes.
