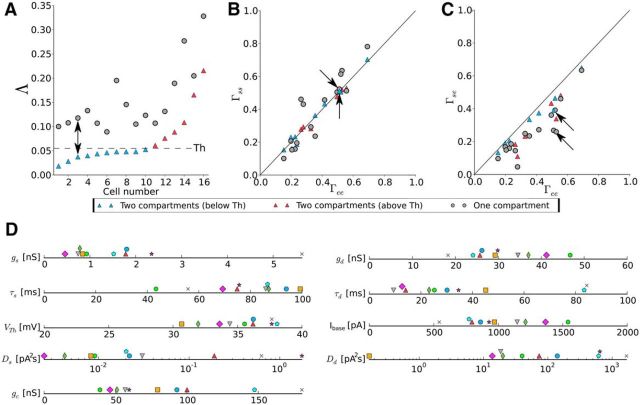
Figure 9.
The two-compartment model performs systematically better than the one-compartment model. A, The goodness-of-fit measure (Λ) for the one-compartment model (gray) and the two-compartment model (blue, red). The dashed line indicates the threshold for distinction between fits below threshold (blue) and above threshold (red). Cells (n = 16) are sorted according to their two-compartment Λ values. The arrow marks the cell shown in Figure 8. B, Scatter plot for the trial-to-trial reliability in experiments, Γee, and simulations, Γss. Data points are distributed along the diagonal, but data for the one-compartment model are spread in a wider region. The color coding and the arrows are the same as in A. C, Scatter plot for the trial-to-trial reliability in experiment, Γee, and the similarity between experiment and simulation, Γse. The two-compartment model is closer to the diagonal (performs better) than the one-compartment model. The color coding and the arrows are the same as in A. D, Graphical representation of the nine parameter values for the two-compartment model. Each symbol/color belongs to a specific cell (some symbols have been shifted vertically for better visibility). Only parameter values for the 10 cells with Λ below threshold are given.

