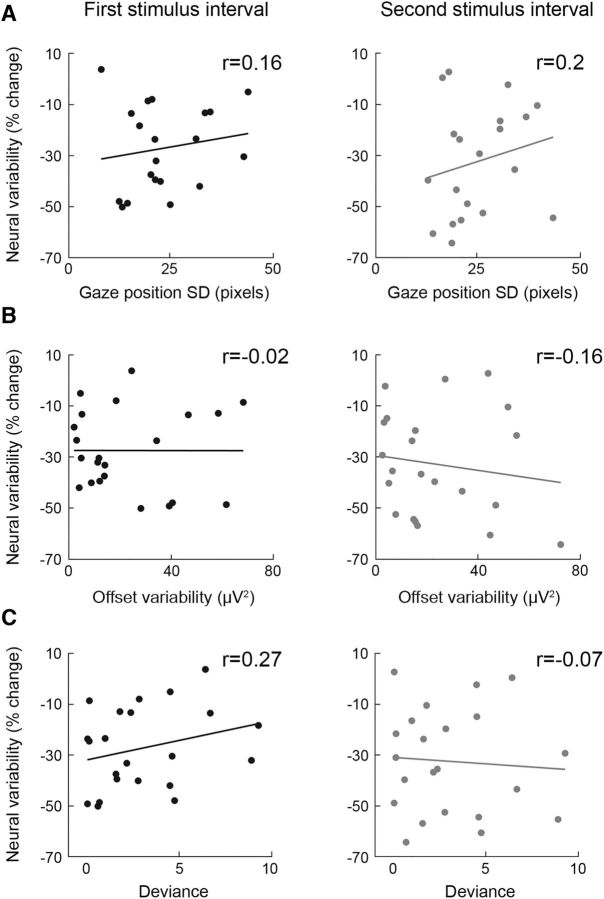
Figure 11.
Individual magnitudes of variability quenching were not correlated with different sources of measurement noise. A, Correlation between variability quenching and gaze variability across trials in the first (left) and second (right) stimulus intervals. B, Correlation between variability quenching and electrode offset variability across trials in the first (left) and second (right) stimulus intervals. C, Correlation between variability quenching and the goodness-of-fit of individual psychometric functions in the first (left) and second (right) stimulus intervals. Each point represents a single subject. Correlation coefficients are noted in each panel.

