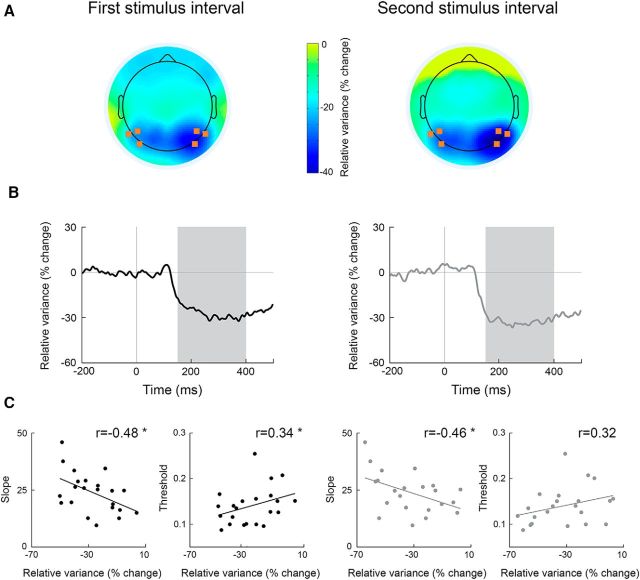
Figure 3.
Neural variability quenching predicts perceptual performance. Neural variability quenching was estimated in the first (left) and second (right) stimulus intervals. A, Topographic maps (mean across subjects) representing the level of variability quenching 150–400 ms after stimulus presentation. B, Time courses of trial-by-trial variability in percentage change units demonstrating the decrease in neural variability after stimulus presentation (mean across electrodes noted in A and across subjects). Because neural variability decreased and remained stable between 150 and 400 ms after stimulus presentation (marked in gray), we estimated the level of variability quenching for each subject as the mean across this time window. C, Correlations between relative neural variability (quenching) and psychometric function slope (left) or contrast discrimination thresholds (right). Each dot represents a single subject. Asterisks indicate significant correlations as assessed by a randomization test (p < 0.05).

