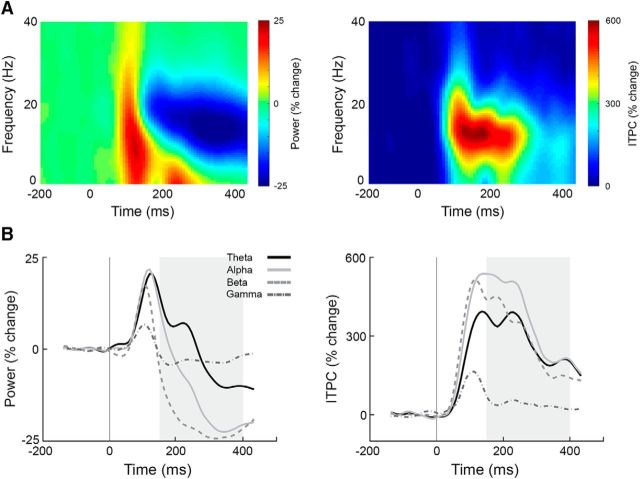
Figure 7.
Spectral power and ITPC dynamics (mean across all subjects). A, Time–frequency spectrograms of the spectral power (left) and ITPC (right) demonstrating the change in power and phase coherence as a function of time, with color representing the amplitude of change relative to the prestimulus interval (−200 to 0 ms) in percentage change units. B, Time courses of four frequency bands: theta (4–7 Hz; black lines), alpha (8–13 Hz; light gray lines), beta (14–20 Hz; light gray dotted lines), and low-gamma (25–40 Hz; dark gray dotted line). Area marked in gray (150–400 ms) corresponds to time window with sustained neural variability quenching in Figure 3.

