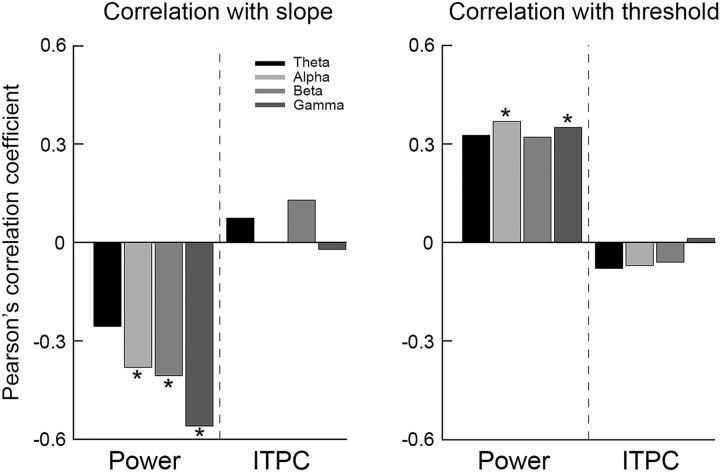
Figure 9.
Better perceptual performance is associated with decreased power rather than increased ITPC. Pearson's correlation coefficients describing the relationships between psychometric function slope (left) or discrimination threshold (right) and spectral power or ITPC as estimated in four frequency bands: theta (black), alpha (light gray) beta (gray), and low-gamma (dark gray). Asterisks indicate significant correlations as assessed by a randomization analysis (p < 0.05).

