Figure 1.
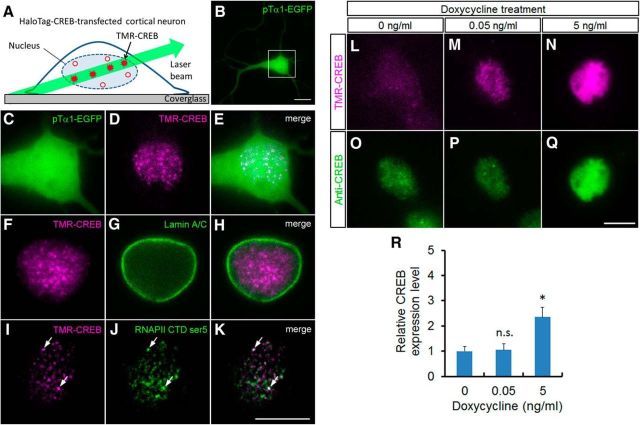
Single-molecule imaging of CREB in cortical neurons. A, Experimental design of single-molecule imaging to visualize TMR-CREB in the nuclei of cortical neurons. A limited number of TMR-CREB molecules in the nucleus are observed with low background using HILO microscopy. B, A cortical neuron transfected with pTα1-EGFP and HaloTag–CREB was observed at 7 DIV. C–K, Subcellular localization of TMR-CREB in fixed HaloTag–CREB-transfected cortical neurons using HILO fluorescence microscopy. C, Magnified image of the box in B. The cortical cells were immunostained with anti-lamin A/C antibody (G, H), anti-Ser5-RNAPII C-terminal domain (J, K), and CREB signals were visualized by TMR-conjugated HaloTag ligand (D, E, F, H, I, K). I–K, Series of images (0.2 μm × 50 sections) were subjected to a deconvolution algorithm. Arrows indicate TMR-CREB colocalized with Ser5-phosphorylated RNAP II C-terminal domain. Scale bar, 10 μm. L–Q, The endogenous and exogenous CREB expression level in the HaloTag–CREB-expressing neurons. Fluorescence images of TMR-CREB (L–N) and immunostaining with anti-CREB antibody (O–Q) in fixed HaloTag–CREB-transfected cortical neurons when adding different concentration of doxycycline (0, 0.05, 5 ng/ml). R, The quantitative analysis shows the relative expression level of CREB in transfected neurons treated with different doxycycline concentrations. Bars represent the mean ± SD. The number of neurons analyzed is 21 (0 ng/ml), 15 (0.05 ng/ml), and 15 (5 ng/ml) cells, respectively. The asterisk indicates a significant difference in untreated neurons (0 ng/ml; ANOVA with Tukey–Kramer post hoc tests, *p < 0.001).

