Figure 2.
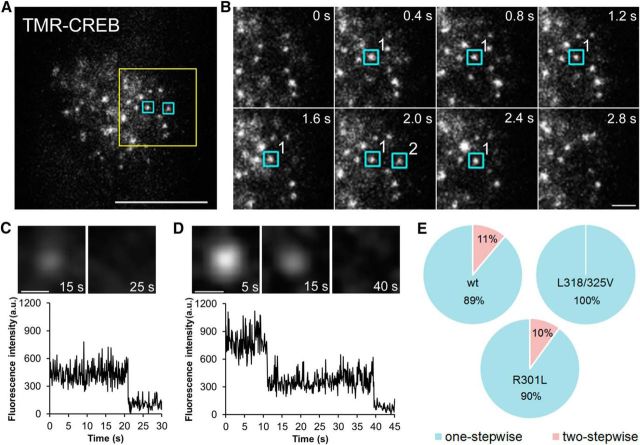
Binding dynamics of CREB in the nuclei of living cortical neurons. A, HILO image showing individual TMR-CREB spots in the nucleus at 5 DIV. Scale bar, 10 μm. B, Time-lapse images of the yellow box in A. The blue boxes indicate TMR-CREB spots with long (>1 s, spot 1) and short (<1 s, spot 2) residence times at restricted locations. Scale bar, 2 μm. C, D, TMR-CREB spots exhibit one-stepwise (C) or two-stepwise (D) reductions of the fluorescence intensities. Scale bar, 0.5 μm. E, The pie graph shows the ratio of one-stepwise and two-stepwise reduction of the fluorescence intensities in wild-type and mutant CREB (L318/325V, R301L).

