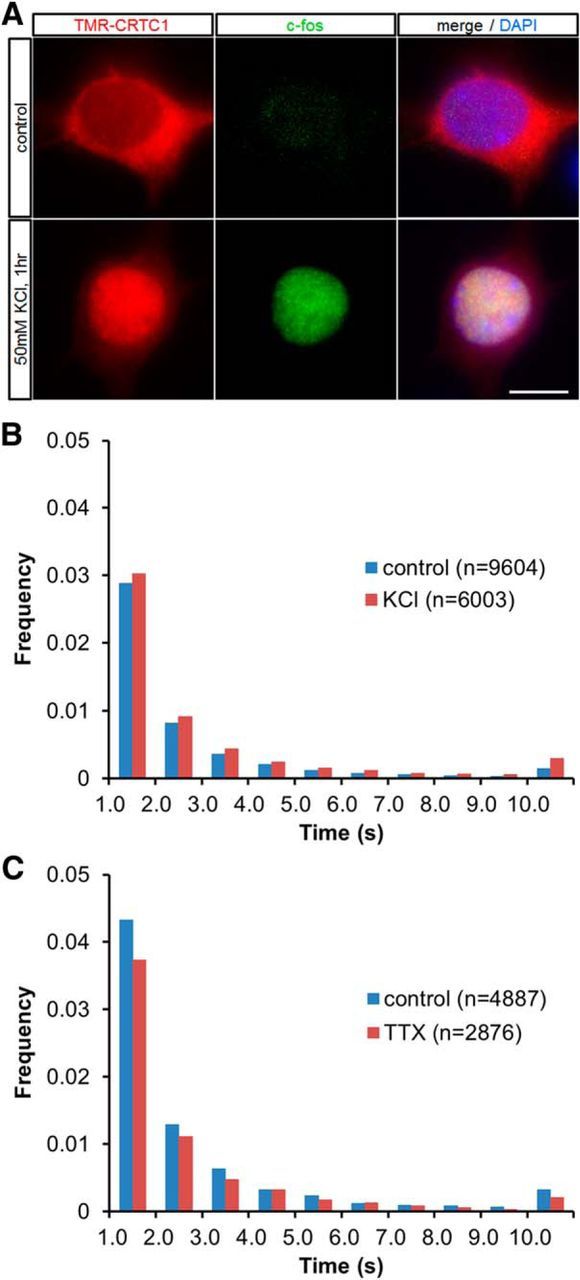
Figure 4.

Dynamics of CREB in response to changing neuronal activity by pharmacological treatment. A, Subcellular localization of TMR-CRTC1 in fixed HaloTag–CRTC1-transfected neurons with or without KCl treatment (50 mm) for 1 h at 7 DIV. Immunocytochemical staining was also performed with c-fos antibody and DAPI. Scale bar, 10 μm. B, Distribution histograms show the long (>1 s) residence times of TMR-CREB spots in untreated (control) cortical neurons at 7 DIV or in those treated with 50 mm KCl for 1 h. The number of spots analyzed is presented in parentheses. C, Distribution histograms show the long (>1 s) residence times of TMR-CREB spots in untreated (control) cortical neurons at 14 DIV and in those treated with TTX for 24 h. The number of spots analyzed is presented in parentheses.
