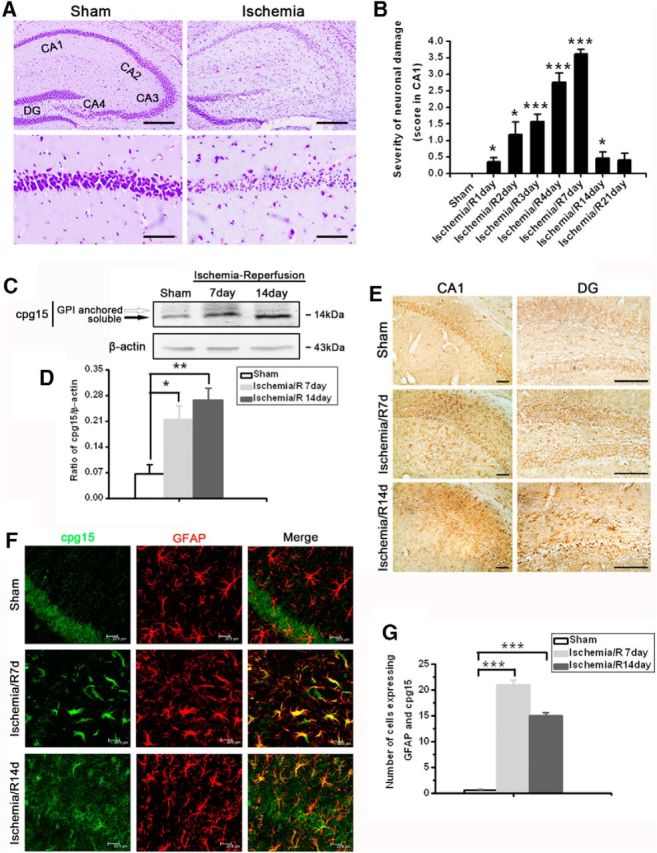
Figure 1.

Global cerebral ischemic injury significantly increases cpg15 expression in astrocytes. A, Representative CV staining analysis of neuronal injury in mouse hippocampus after TGI. Bottom, Magnified from the Top images. Scale bars: Top, 50 μm; Bottom, 6 μm. B, Severity of hippocampal damage at reperfusion days 1–21 after TGI (Ischemia/R1–R21 d), assessed as described in Materials and Methods. Sham, n = 5; all other groups, n = 8. *p < 0.05, compared with the sham group. ***p < 0.001, compared with the sham group. DG, Dentate gyrus; CA1–4, cornus ammonis sectors 1–4. C, Representative Western blot images showing the expression of cpg15 protein in mouse hippocampus at reperfusion 7 and 14 d after TGI (two bands were detected, GPI-anchored and soluble cpg15). D, Relative amount of cpg15 protein in mouse hippocampus at reperfusion 7 and 14 d after TGI (statistical data from the Western blot images). β-Actin is used as the loading control. Sham, n = 3; all other groups, n = 6. *p < 0.05, compared with the sham. **p < 0.01, compared with the sham. E, Immunohistochemical analysis of cpg15 expression in mouse hippocampal CA1 and DG regions at reperfusion 7 and 14 d after TGI. Scale bars, 100 μm. F, Immunofluorescent double staining analysis of cpg15 (green) and astrocytic marker GFAP (red) showing that cpg15 was upregulated obviously in astrocytes in mouse hippocampal CA1 region at reperfusion 7 and 14 d after TGI. Scale bars, 20 μm. G, Statistical data from F showing the cell number expressing both GFAP and cpg15 proteins in mouse hippocampal CA1 region at reperfusion 7 and 14 d after TGI. Sham, n = 3; all other groups, n = 8. ***p < 0.001, compared with the sham. The hippocampus of sham-operated mice was used as the control.
