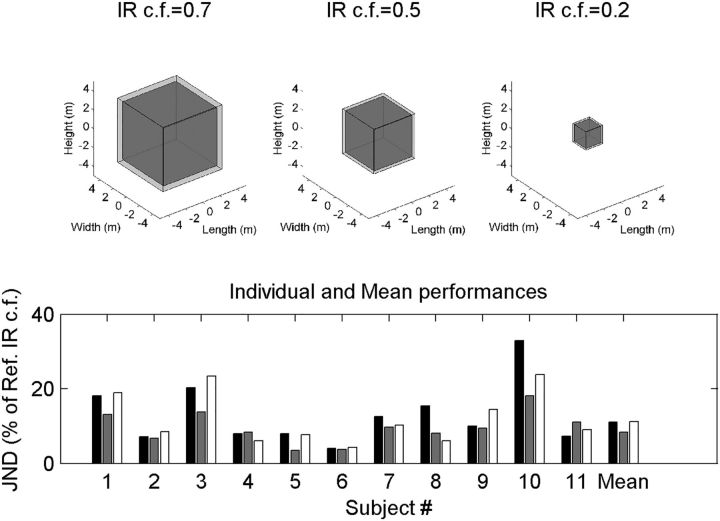
Figure 2.
JNDs in room size. Top, Average JNDs illustrated in terms of the changes in the size of a cubic room with equivalent reverbration time (Sabine, 1923). Bottom, Individual JNDs are plotted for each subject and each room size and the mean on the far right. The individual data reveal that subjects performed quite differently, with some subjects having JNDs as low as 3%–4% and others having JNDs between 20% and 35%. Right, Across-subject mean. IR c.f., Impulse response compression factor.

