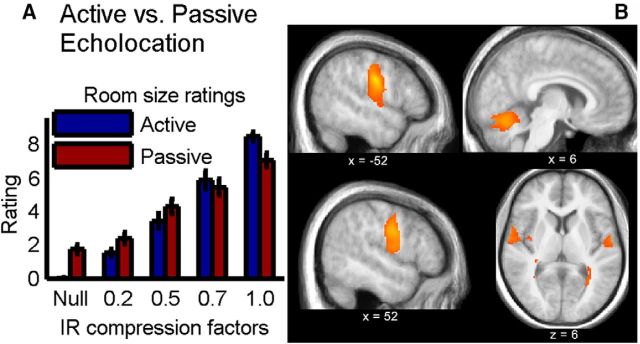
Figure 4.
Active versus passive echolocation. A, Behavior: subjects' rating of the perceived room size, in both active (blue) and passive (red) echolocation, for the four BRIR compression factors (room sizes). Error bars indicate SE across subjects. B, Neuroimaging: differential activations between active and passive echolocation show stronger motor activity during active echolocation, although the motor behavior was subtracted from the activity: (active echolocation − active null condition) − (passive echolocation − silence). Significant voxels (p < 0.05, FDR corrected) are shown as a heat map overlaid on the mean structural image from all subjects from the control experiment. Coordinates are given in MNI space (for details, see Table 1).

