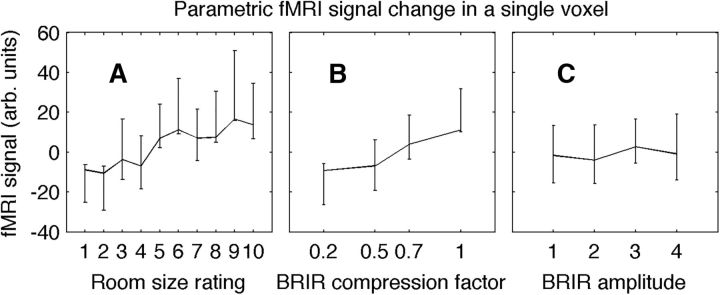
Figure 6.
An example of the parametric modulations in the hemodyamic response with respect to the experimental parameters. The BOLD signal values in a single voxel (MNI coordinates x, y, z = 57, −27, 45) in the right supramarginal gyrus of the inferior parietal lobe were averaged over room size rating (A), reverberation scaling (B), and amplitude (C) in an example subject. It is clear here that activity in this voxel was related to both the reverberation scaling and room size rating but not the amplitude. All three experimental parameters were used to model activity across the brain (Fig. 7). Data are mean ± SEM.

