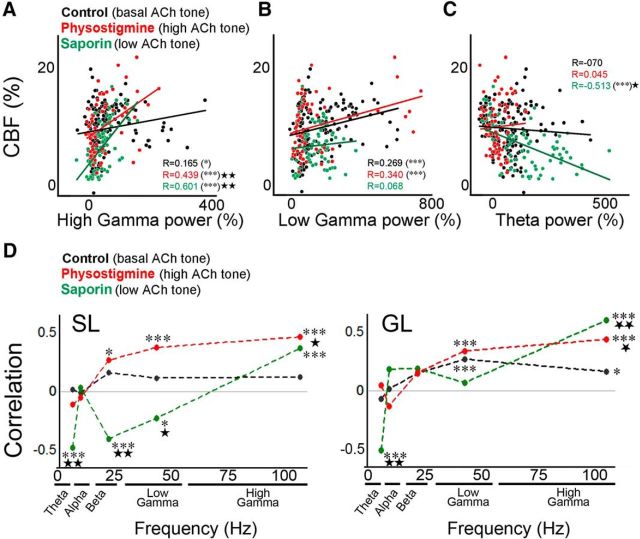
Figure 5.
Correlations between electrophysiological (LFP) and hemodynamic (CBF) signals as a function of frequency band and ACh tone. In GL, CBF changes during whisker stimulation were significantly and positively correlated (r: Pearson's coefficient) with the concomitant changes in high- and low-gamma power (A, B) under control (black, saline-injected rats), enhanced (red, physostigmine), and low (green, saporin) ACh tone. In the theta band (C), the saporin group displayed a significant negative correlation and a slope significantly different from controls, whereas correlations were not significant for the other ACh conditions. D, CBF/LFP correlations as a function of the power of LFP in given frequency band and of ACh tone. Individual symbols represent individual trials (A–C) or Pearson's coefficients between CBF and the power of the given frequency band for each group (D). *p < 0.05; ***p < 0.001 for Pearson's r and *p < 0.05; ***p < 0.001 for either slope comparison test (A–C) or for Fisher's r-to-z transformation for between-group differences in correlation coefficients (D) compared with controls. Saporin (n = 74 from 9 rats), controls (n = 161 from 18 rats), and physostigmine (n = 67 from 8 rats).

