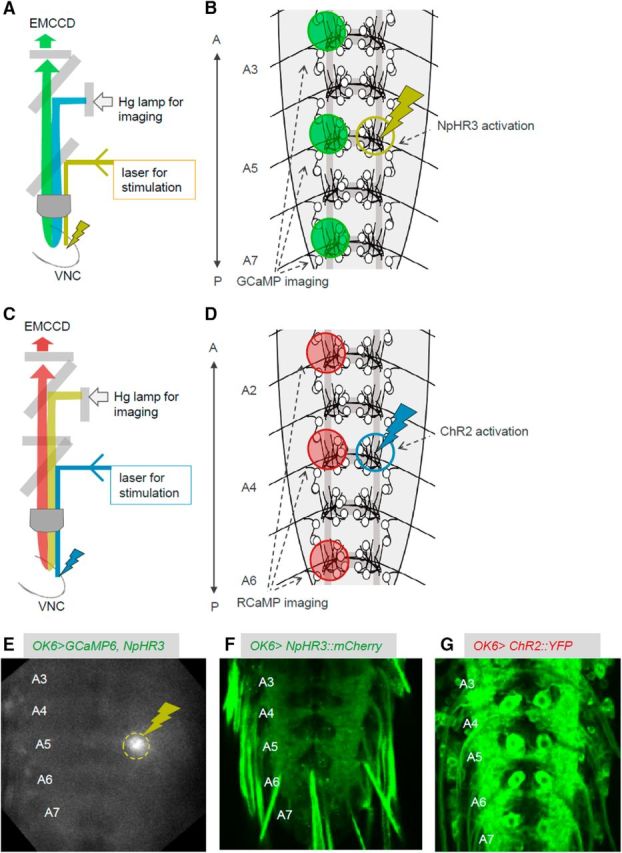
Figure 2.

The experimental system used for simultaneous local photomanipulation and calcium imaging. A, B, Schematics showing the experimental setup (A) and ROIs (B) for simultaneous photoinhibition and calcium imaging. C, D, Schematics showing the experimental setup (C) and ROIs (D) for simultaneous photoactivation and calcium imaging. E, Snapshot during the experiment showing the light stimulation for optical inhibition (dashed yellow circle). F, G, NpHR3::mCherry (F) and UAS-ChR2 (T159C)::YFP (G) expression in MNs. A, Anterior; P, posterior.
