Figure 4.

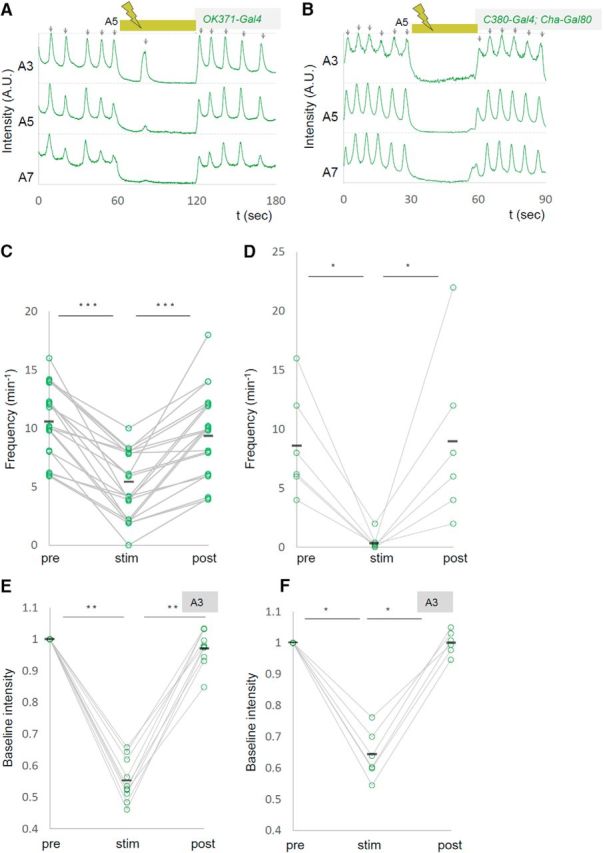
Decreased motor waves induced with independent MN Gal4 drivers. A–F, Representative plots of calcium imaging (A, B) and changes in the frequency of motor waves (C, D) and normalized baseline intensity in A3 (E, F) are shown as in Figure 3. OK371-Gal4 (A, C, E) or C380-Gal4; Cha-Gal80 (B, D, F) were used as drivers. *p < 0.05; **p < 0.01; ***p < 0.001 (Wilcoxon signed-rank test).
