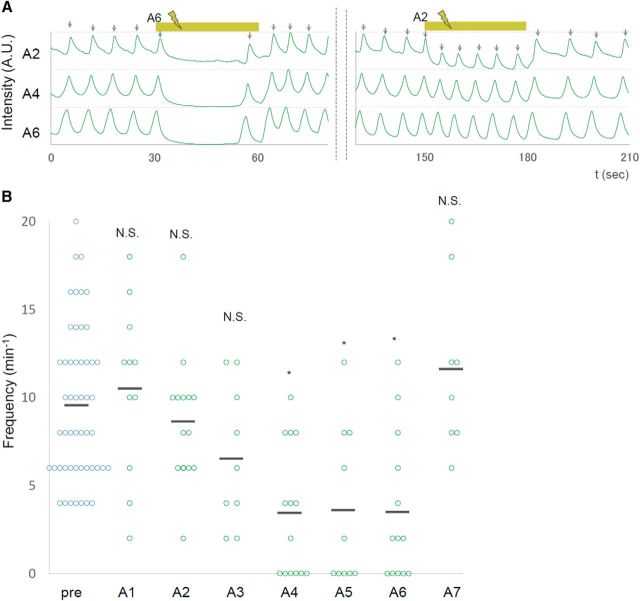
Figure 5.
Segment specificity in the effects of local photoinhibition of MNs. A, Normalized fluorescent intensity in A2, A4, and A6 are plotted. Yellow bars indicate the duration of yellow light stimulation in A6 (30–60 s) and A2 (150–180 s). B, Frequency of motor waves before (pre) and during stimulation in each of the A1–A7 segments. *p < 0.05 (Steel's test).

