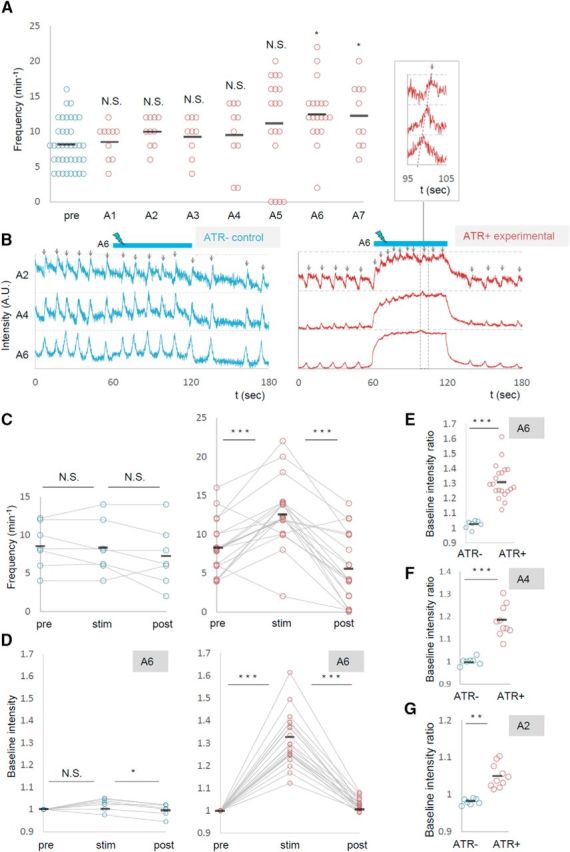
Figure 6.

Photoactivation of MNs in posterior segments increased the frequency of motor waves. A, Frequency of motor waves before (pre) and during photoactivation in segments A1 to A7. B–G, Increased motor waves upon MN activation in A6. B, Representative plots of normalized fluorescent intensity in control (ATR−, left) and experimental (ATR+, right) groups. ROIs were made in a region surrounding the nerve root of A2, A4, and A6 in the contralateral side of the optical manipulation as shown in Figure 2D. Blue bars (60–120 s) indicate the duration of light stimulation. C–G, Changes in the frequency of motor waves (C) and normalized baseline intensity in A6 (D, E), A4 (F), and A2 (G) upon optical activation of A6. *p < 0.05 (Steel's test; A); *p < 0.05, ***p < 0.001 (Wilcoxon signed-rank test; C, D); **p < 0.01, ***p < 0.001 (Mann–Whitney U test; E–G).
