Figure 7.
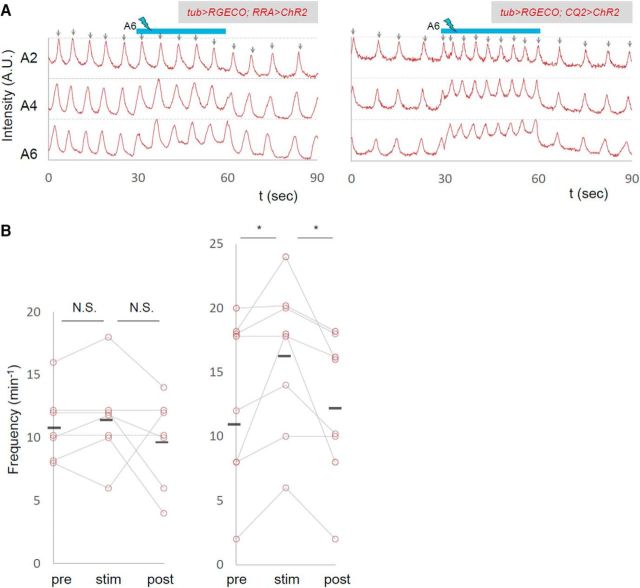
Photoactivation of U MNs increased the frequency of motor waves. The effects of local photoactivation of small subsets of MNs. A, Representative plots of normalized fluorescent intensity upon photostimulation of ChR2, whose expression is driven by RRA-Gal4 (left) and CQ2-Gal4 (right). ROIs were made in a region surrounding the nerve root of A2, A4, and A6 in the contralateral side of the optical manipulation as shown in Figure 2D. Blue bars (30–60 s) indicate the duration of light stimulation. B, Changes in the frequency of motor waves upon optical manipulation are plotted. *p < 0.05 (Wilcoxon signed-rank test).

