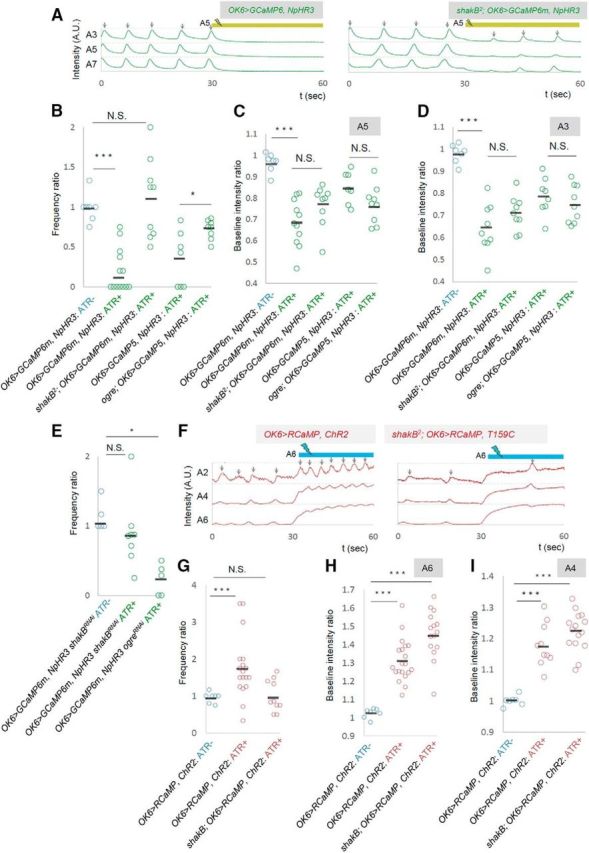
Figure 8.

shakB and ogre are involved in the changes in wave frequency. A–D, The effects of local photoinhibition in shakB2 or ogre2 mutants. A, Representative plots of GCaMP fluorescent intensity in control (left) and shakB2 (right) are shown as in Figure 2A. B–D, Frequency ratio of motor waves (B) and baseline fluorescent intensity in A5 (C) and A3 (D). E, The frequency ratio of local photoinhibition in shakB and ogre RNAi knockdown in MNs (driven by OK6-Gal4). F–I, The effects of local photoactivation in shakB2 mutants. F, Representative plots of RCaMP fluorescent intensity in control (left) and shakB2 (right). G–I, Frequency of motor waves (G) and baseline fluorescent intensity in A6 (H) and A4 (I). *p < 0.05; ***p < 0.001 (Mann–Whitney U test).
