Figure 3.

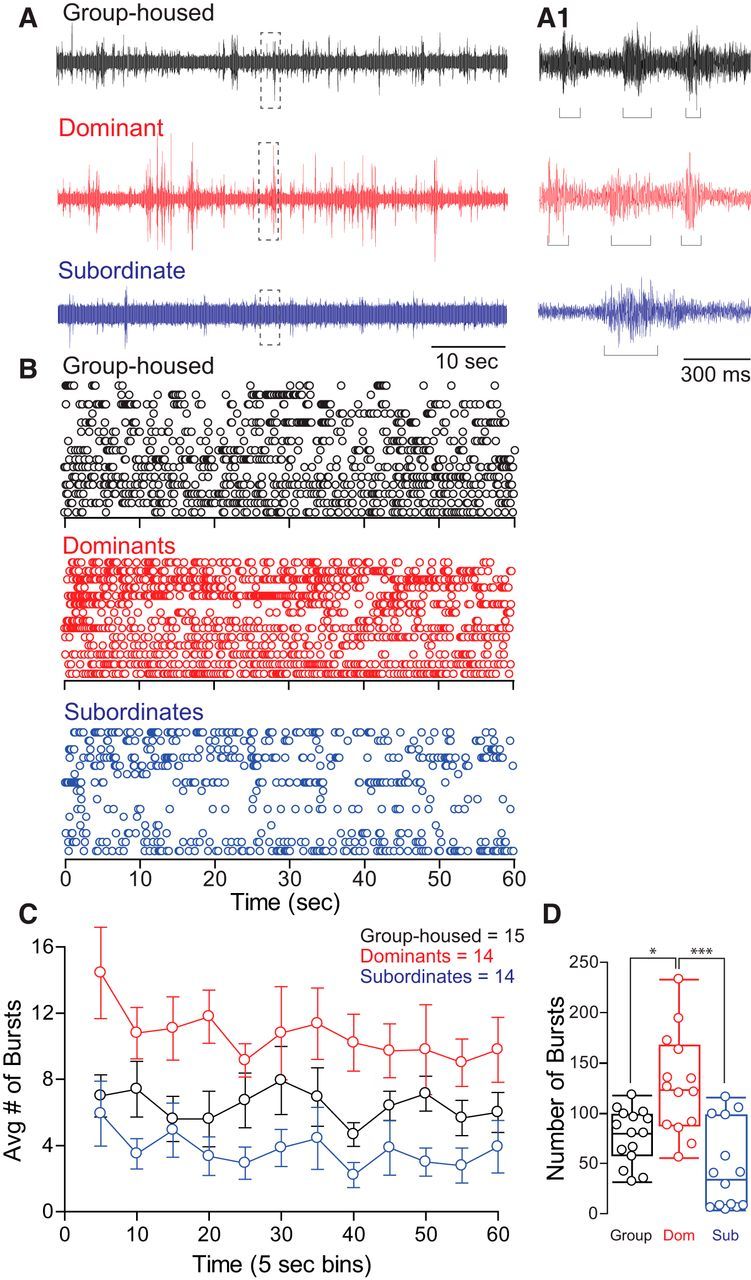
Social status affects swimming burst frequency. A, One minute individual trace recordings of field potentials from group-housed, dominant, and subordinate animals. Swim bursts are easily identifiable and individually sorted (A1, brackets) (dashed boxes denote areas that are enlarged in A1). B, Raster plots of each social animal group tested. Each row represents the burst swim responses of one animal, and each circle represents one swim burst (for burst analysis and quantification, see Materials and Methods). C, Averaged binned data of swim burst activity of data illustrated in A and B (burst activity was binned over 5 s). Means ± SEM are plotted. D, Box plot summary illustrating differences in the number of bursts produced over 1 min of recording. Each dot represents sum of spontaneous swim bursts for each animal during 60 s of recording. The horizontal line within each box plot denotes the data median; the box represents 90% of data. Error bars represent the max/min values (n = 15 group housed, 14 dominants, 14 subordinates).
