Figure 4.
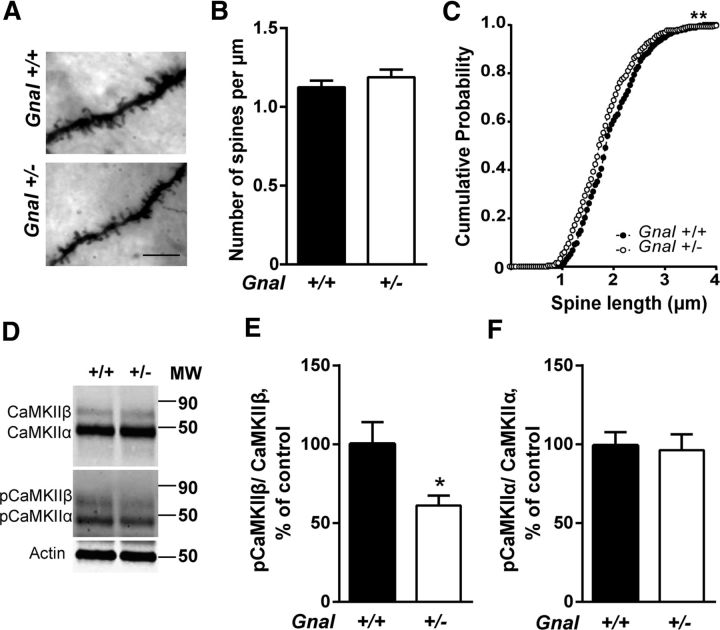
Spine analyses in dorsal striatum. A, Examples of Golgi-stained dendrites of SPNs in Gnal+/+ and Gnal+/− mice. Scale bar, 7 μm. B, Spine density quantification showed no significant difference between genotypes (t = 1, p = 0.3, with a total of ∼50 dendrites measured in three mice per group). C, Distribution of spine lengths in SPN dendrites showed a significant reduction in Gnal+/− mice compared with WT littermates (Kolmogorov–Smirnov test, d = 0.12; **p < 0.01). D, Immunoblots of total CaMKIIα and β and their phosphorylated forms (pCaMKIIα and β). Actin was measured as loading control. E, F, Quantification of pCaMKIIβ/CaMKIIβ (t = 2.6, p < 0.05) (E) and pCaMKIIα/CaMKIIα (t = 0.2, p = 0.8) (F) ratios. Data are shown as means ± SEM. *p < 0.01, two-tailed unpaired t test with Welch's correction.

