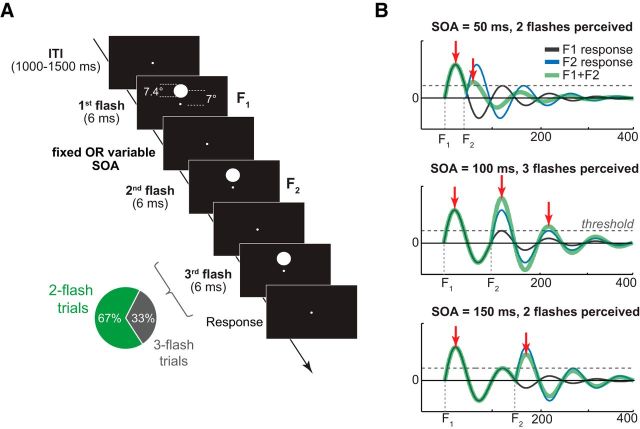
Figure 1.
Trial structure and Bowen's theoretical model. A, On each trial, two or three high-contrast circle stimuli were presented in rapid succession above the fixation dot. SOA on two-flash trials was either variable (Experiment 1) or fixed (Experiment 2); three-flash trial SOA was variable in both experiments. B, Oscillatory model of brain response to two consecutive light flashes (adapted from Bowen 1989). Thin black and blue lines indicate an IRF to the first and the second flash, respectively. Thick green line indicates a linear sum of IRFs to two flashes. Horizontal dashed lines indicate a hypothetical perceptual threshold which, when exceeded, gives rise to the perception of a flash. Top and Bottom, The delay between veridical flashes is suboptimal for the third-flash perception to occur (i.e., too short, SOA = 50 ms, and too long SOA = 150 ms). Middle, Scenario when the second flash is presented ∼100 ms relative to the first flash, resulting in a perfect superposition of the two IRFs and a third-flash percept.

